Copy of Daily FX Technical Trend Bias Key Levels Fri 31 May
EUR/USD – Bears are still finding hard to break below 1.1120

click to enlarge chart
- Yesterday’s drop has managed to hold at the 1.1120 key short-term pivotal support as per highlighted in our previous report (click here for a recap). Several positive elements have been sighted as well; the shorter-term hourly RSI oscillator has staged a bullish breakout above a corresponding descending resistance in parallel with the minor price action resistance in place since 27 May 2019 high after a prior bullish divergence signal at its oversold region. Also, the pair has ended yesterday’s U.S. session with a daily bullish “Spinning Top” candlestick pattern.
- Maintain bullish bias and a break above 1.1160 is likely to reinforce a potential corrective rebound towards the 27 May minor swing high of 1.1215 in the first step. However, an hourly close below 1.1120 resumes the bearish impulsive downleg sequence towards the next near-term support at 1.1060/1040 (Fibonacci retracement/expansion cluster).
GBP/USD – 1.2600 remains the key support to watch

click to enlarge chart
- The pair has managed to hold at the 1.2600 key short-term pivotal support and rebounded from the median line of the minor descending channel in place since 03 May 2019 high. Maintain bullish bias and added an upside trigger level at 1.2650 and a break above it reinforces a potential corrective rebound towards the 1.2750 intermediate resistance.
- However, an hourly close below 1.2600 resumes the slide towards the major support at 1.2545/2530 (also the primary ascending range support in place since 07 Oct 2016 low).
USD/JPY – Further push down in progress

click to enlarge chart
- The pair has staged a failure bullish break above the 109.70 key short-term pivotal resistance as per highlighted in our previous report and inched back down to retest this week low at around the 109.20 level. Interestingly, yesterday’s push up has stalled below the former minor ascending support from 13 May 2019 low and the 50% Fibonacci retracement of the previous slide seen from 21 May high to 29 May 2019 low. Tolerate the excess and maintain the bearish bias with an adjusted short-term pivotal resistance now a 109.90 for a further potential push down towards the major support at 108.60/50.
- However, an hourly close above 109.90 invalidates the bearish scenario for a squeeze up towards the next resistance at 110.65 (21 May 2019 swing high area).
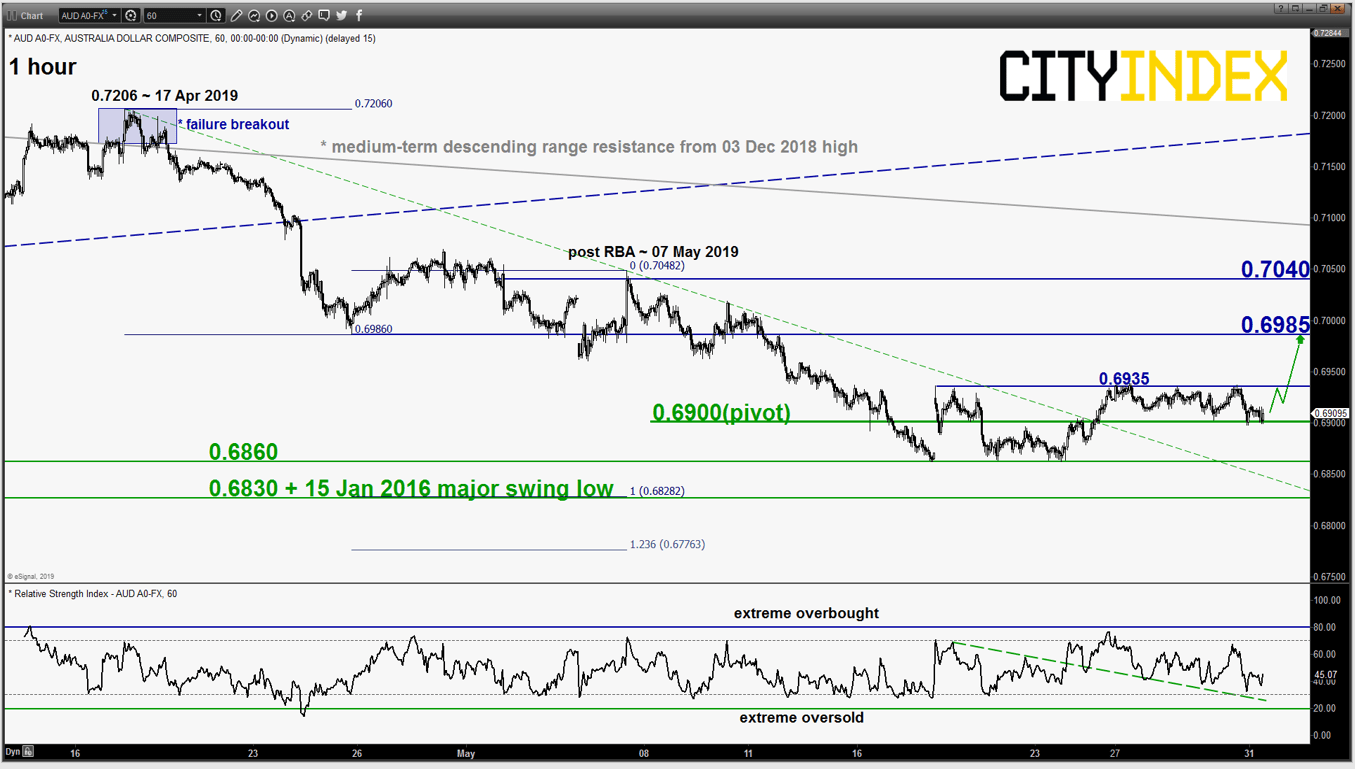
AUD/USD – Bulls continue to defend 0.6900
click to enlarge chart
- Continued to trade sideways and managed to hold at the 0.6900 key short-term pivotal support. Maintain bullish bias and added 0.6935 (minor range top) as the upside trigger level; a break above it reinforces the potential corrective rebound scenario to target the next intermediate resistance at 0.6985.
- However, an hourly close below 0.6900 resumes the slide for a retest on 0.6860 before targeting 0.6830 next.
Charts are from eSignal
From time to time, StoneX Financial Pty Ltd (“we”, “our”) website may contain links to other sites and/or resources provided by third parties. These links and/or resources are provided for your information only and we have no control over the contents of those materials, and in no way endorse their content. Any analysis, opinion, commentary or research-based material on our website is for information and educational purposes only and is not, in any circumstances, intended to be an offer, recommendation or solicitation to buy or sell. You should always seek independent advice as to your suitability to speculate in any related markets and your ability to assume the associated risks, if you are at all unsure. No representation or warranty is made, express or implied, that the materials on our website are complete or accurate. We are not under any obligation to update any such material.
As such, we (and/or our associated companies) will not be responsible or liable for any loss or damage incurred by you or any third party arising out of, or in connection with, any use of the information on our website (other than with regards to any duty or liability that we are unable to limit or exclude by law or under the applicable regulatory system) and any such liability is hereby expressly disclaimed.
FOREX.com is a trading name of StoneX Financial Pty Ltd.
The material provided herein is general in nature and does not take into account your objectives, financial situation or needs.
While every care has been taken in preparing this material, we do not provide any representation or warranty (express or implied) with respect to its completeness or accuracy. This is not an invitation or an offer to invest nor is it a recommendation to buy or sell investments.
StoneX recommends you to seek independent financial and legal advice before making any financial investment decision. Trading CFDs and FX on margin carries a higher level of risk, and may not be suitable for all investors. The possibility exists that you could lose more than your initial investment and CFD investors do not own or have any rights to the underlying assets.
It is important you consider our Financial Services Guide and Product Disclosure Statement (PDS) available at www.forex.com/en-au/terms-and-policies/, before deciding to acquire or hold our products. As a part of our market risk management, we may take the opposite side of your trade. Our Target Market Determination (TMD) is also available at www.forex.com/en-au/terms-and-policies/.
StoneX Financial Pty Ltd, Suite 42.01, 264 George Street, Sydney, NSW 2000 (ACN 141 774 727, AFSL 345646) is the CFD issuer and our products are traded off exchange.
Delayed London Stock Exchange (LSE) Data
The London Stock Exchange (LSE) market data displayed or referenced on this website is provided on a delayed basis and is not in real time. The delay period may vary but is typically at least 15 minutes. This data is intended for information purposes only and should not be relied upon for trading, investment, or other financial decisions. We do not guarantee the completeness, reliability, or suitability of the data for any particular purpose. Users should consult real-time data sources and obtain professional advice before making any financial decisions.
© FOREX.COM 2026