


Crude Oil Talking Points:
- WTI Crude Oil is up by 11.65% so far this week, on pace for its second strongest weekly gain since the Iran war began back in March.
- At this point inflation data has stolen the show but continued strength in oil prices could add some definition there as higher oil prices will build expectations for even more inflation down the road, both in core and non-core reads.

Markets don’t always display a clean and logical reaction to what otherwise seems an obvious stimuli. In some cases, such as the sell-off in stocks in early-March to go along with a rally in the USD as oil prices jumped above the $100 level, that relationship is very clean and clear. In others, however, such as we have now, it’s almost as if there’s an awkward waiting period for another shoe to drop that hasn’t quite come into vision yet.
At this point we have a huge CPI report due tomorrow morning and US Treasury yields have ascended to multi-year (10’s) or multi-decade (30’s) highs. For a US government with a trove of debt coming to maturity over the next year that presents a problem, yet it seems as though the prospect of austerity or higher taxes aren’t even in the conversation, as the line from both President Trump and US Treasury Secretary Scott Bessent is that ‘we will have to grow our way out of debt.”
The earlier-year flare in Oil prices presented a similar problem although there was a ready-made solution, by adding supply to the market via the SPR. But as that has seen inventories drain and as the conflict in Iran has continued, with some broadening in scope of late, the concern is that the supply buffer from the SPR may not present as much assistance as it did earlier in the year.
As such, oil prices have been spiking and WTI is on pace for its second strongest week since the conflict began back in March. In particular, the past three days have been incredibly strong with prices gapping higher and then continuing to rally.
WTI Crude Oil Daily Chart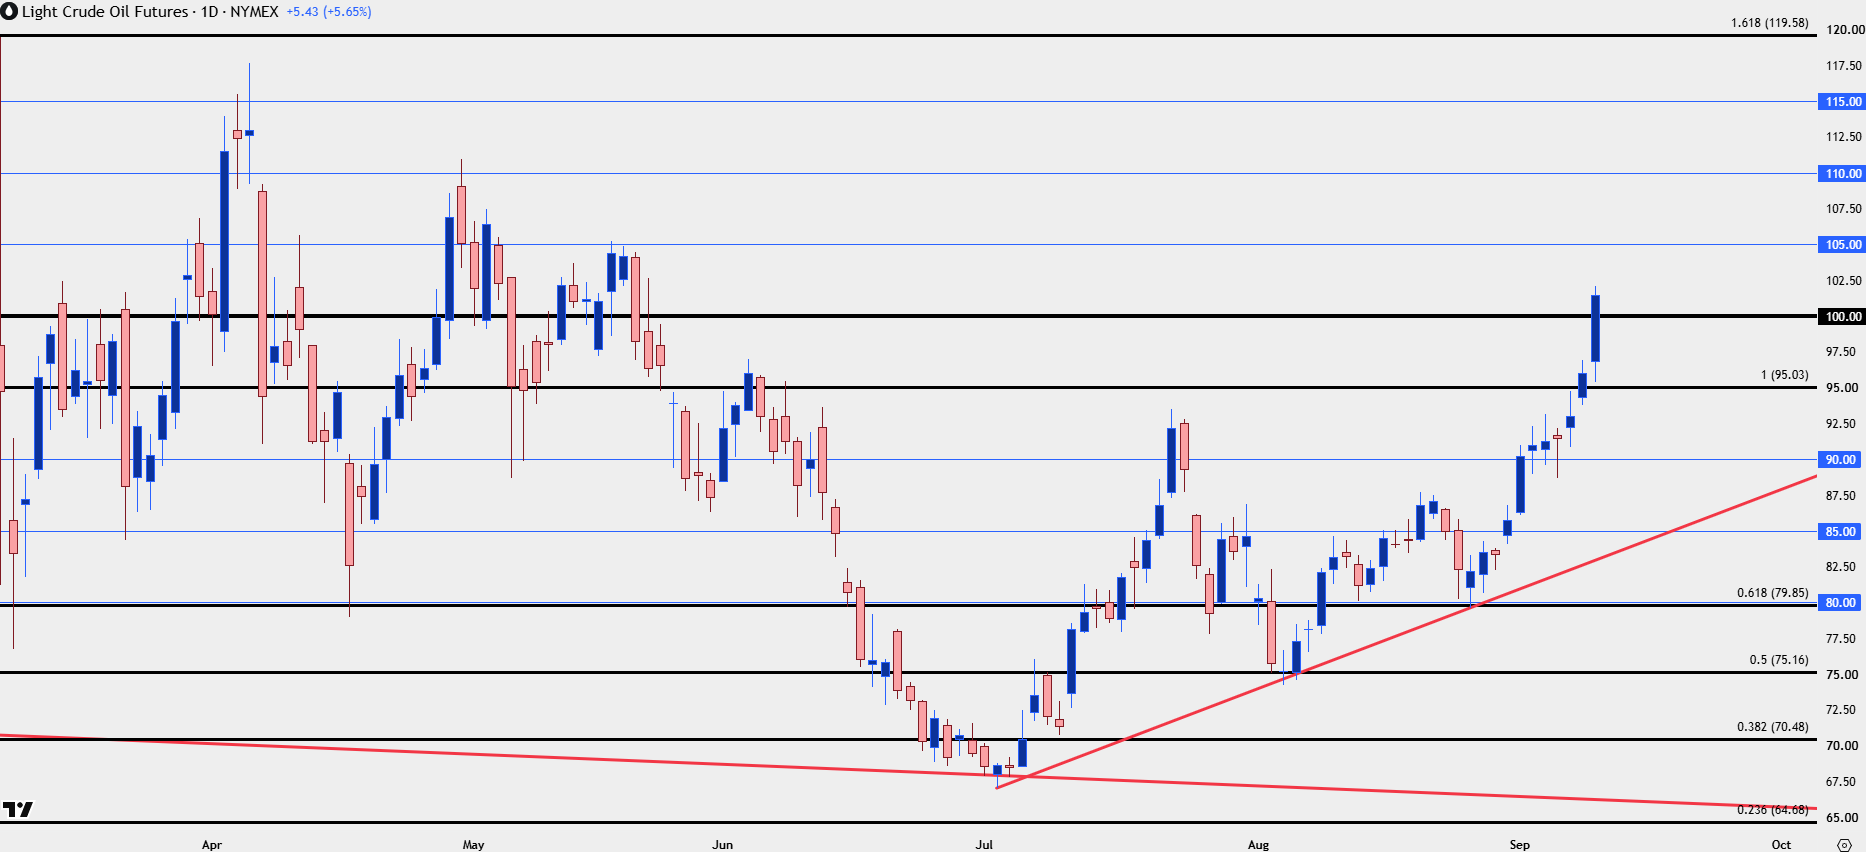
Chart prepared by James Stanley; data derived from Tradingview
WTI Trends
The trend in WTI has been incredibly powerful and while yesterday brought the first $100 test in more than three months, today sees buyers breaking through aggressively with only a minimum of check-back on shorter-term charts,
The risk at this point as we’re moving towards a weekend is the President Trump pump which has become a common variable in oil markets over the past six months. This is something where Trump can give a bit of hope that peace is on the horizon, which could unsettle longs and prod a bit of profit taking ahead of or into the weekend.
And even outside of that, the simple prospect that we may see something similar over the weekend could mean even more anxiety for longs, which could lead in to profit taking after a really strong topside run.
In that case, a pullback to and show of support around that same $100 level could be construed as a sign of value from bulls, and as such, that sets up for an ‘s1’ support level. Below that, it’s the prior swing high at 97.80 that caught two points of resistance until yesterday’s breakout which sets up as an ‘s2.’ And then below that, a familiar level around 95 up to the prior swing low of 95.40 that sets up the ‘s3’ zone for WTI crude oil.
WTI Crude Oil Four-Hour Chart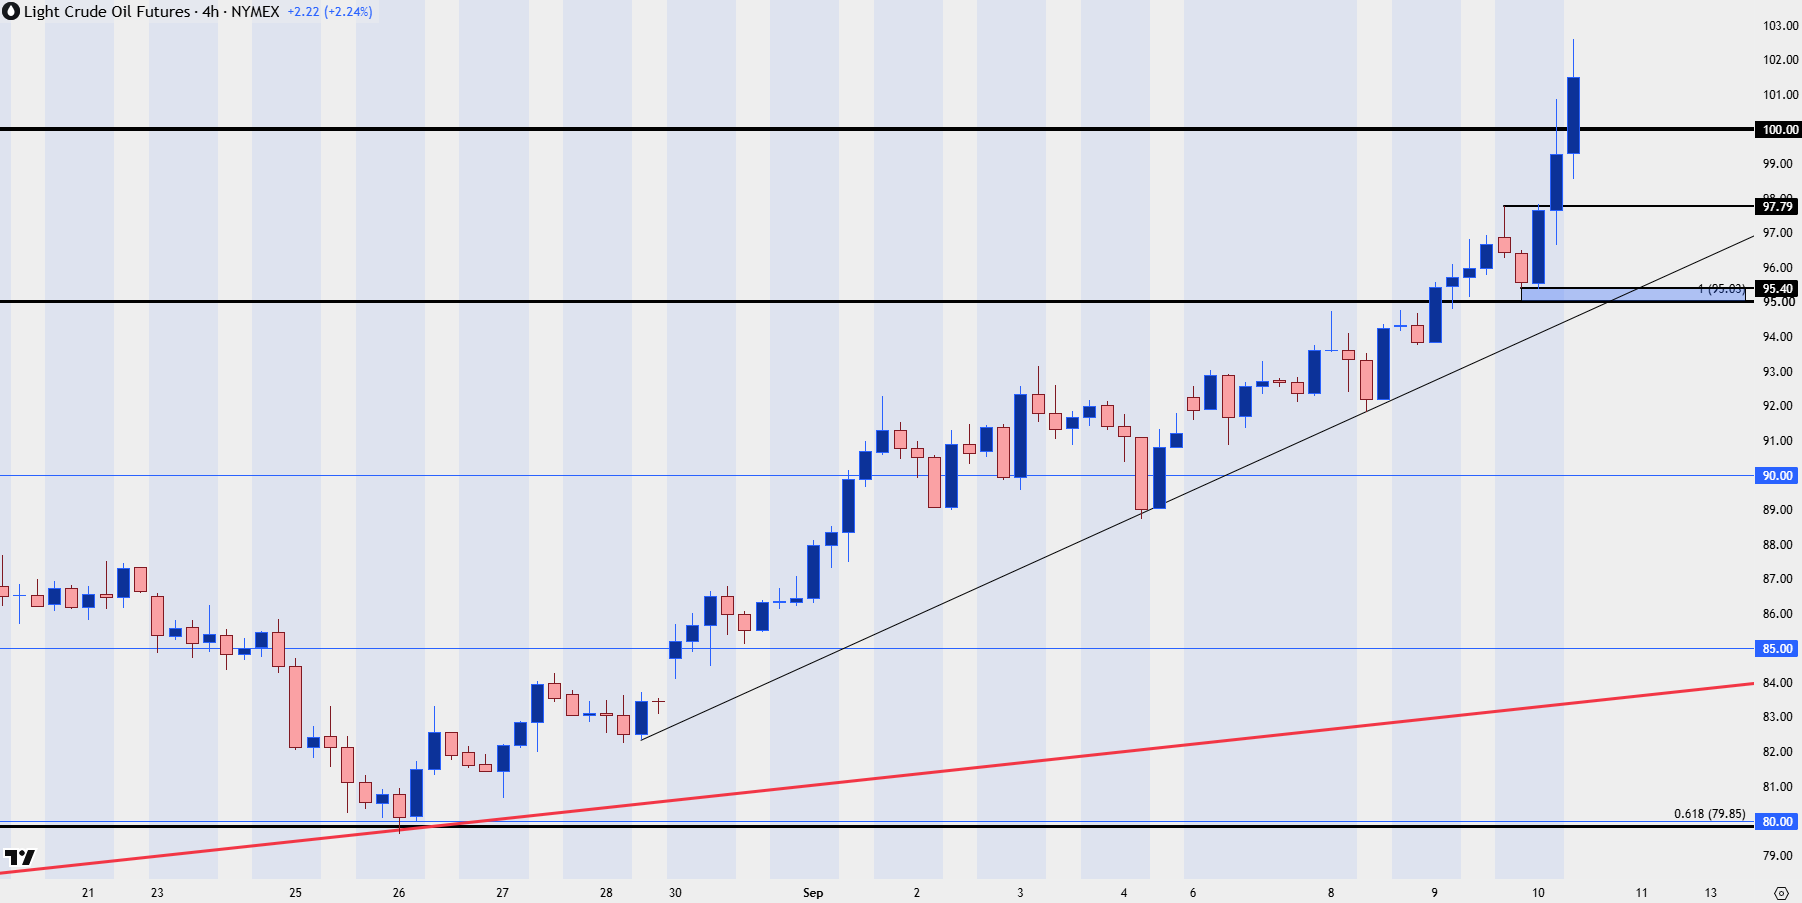
Chart prepared by James Stanley; data derived from Tradingview
--- written by James Stanley, Senior Market Analyst, Global Macro




