
Key Events this Week
- ISM PMIs: to clarify US economic activity (Tuesday–Thursday)
- US NFPs and their impact on rate cut expectations (Friday)
- The effect of US trade and legal developments, and EU political shifts on risk sentiment
Crude oil charts remain stuck between competing forces: supply chain sanctions, trade war tensions, Fed rate cut hopes, and seasonal summer dynamics. The overall trend leans bullish, aligned with global indices amid rate cut optimism, but still faces strong resistance across major technical levels:
- Nasdaq is challenging 23,700
- Dow is challenging 45,700
- Gold is challenging 3,450
- Silver is challenging 40
- USOIL is challenging 65
Geopolitical Pressure and Market Dynamics
The Russia–Ukraine ceasefire situation continues to weigh on the US, as sanctions on Russian oil are creating discounted supply chains that benefit competitors like India and China. These discounts enhance their global competitiveness, allowing them to bypass US tariff threats and strengthen alternative trade networks.
If the US relaxes sanctions or escalates pressure on India and China, global trade could suffer, reducing market risk appetite. This comes on top of market caution around upcoming court rulings on Fed governance and independence. If Trump secures a Fed majority, rapid interest rate cuts could push oil higher — though inflation risks may later trigger global slowdowns and shifts in long-term bond yields.
Summer demand is likely keeping inventories low, with the latest reading showing a draw of -2.4 million barrels versus an expected -1.7 million. This supports WTI near the 65 level. For the uptrend to continue, demand must rise alongside the full reintroduction of OPEC supply into the market, in addition to a revival in broader risk appetite — which remains stagnant for now.
What is the upside potential of crude oil?
Technical Analysis: Quantifying Uncertainties
Crude Oil Weekly Outlook: Daily Time Frame – Log Scale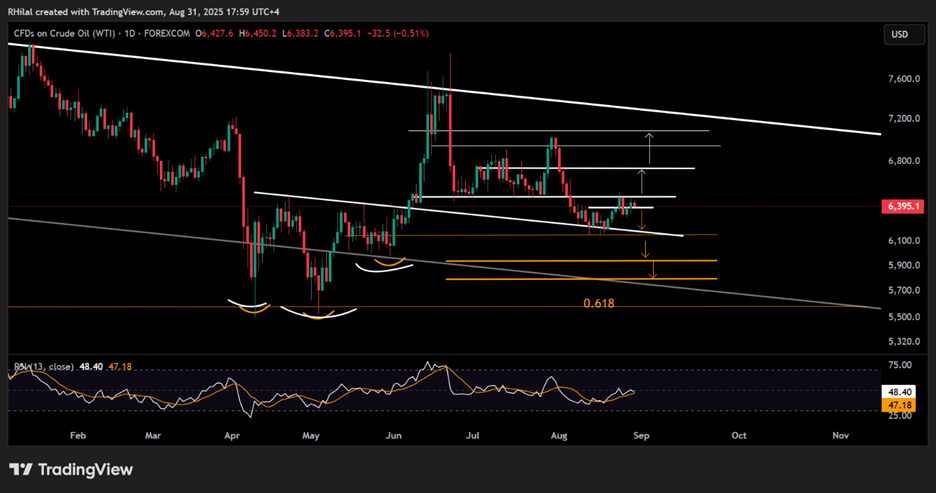
Source: Tradingview
Crude oil has rebounded above the 61.80–62.00 support zone, aligned with the neckline of the earlier inverted head and shoulders formation. The current price action is testing the 65 resistance, with daily momentum, according to RSI, holding near the 50 neutral level.
- A clean hold above 65.20 may confirm further upside potential toward 68.00, 69.40, and 70.40 — the next major resistance levels in view.
- On the downside, 62.00 and 61.80 remain significant support zones. A break below could open the door to deeper losses toward 59.40 and 57.90.
Written by Razan Hilal, CMT
Follow on X: @Rh_waves