


Crude oil and energy markets are at a critical crossroads as tensions around the Strait of Hormuz and Middle East supply disruptions intensify, risking extended energy surges and potential global market downturns in the week ahead. Brent closed near $110, US indices are approaching 2024 peaks with further drawdown risks, and precious metals have returned near their steep February 2026 lows.
The potential closure of the strait is testing the nerves of the Trump administration, given its objective of maintaining lower oil prices, easing inflation, and supporting a lower interest rate environment. This reinforces its stance against further disruptions and escalations should the strait remain closed. This dynamic creates a crossroads for markets and the energy sector: either a deeper global market downturn accompanied by surging energy prices, or a reversion toward mean levels if tensions ease.
I outlined three scenarios on the Strait of Hormuz and their potential impact on crude prices in the previous article, Crude Oil Price Outlook: Strait of Hormuz Scenario Analysis also briefly covered in the following video.
Risk management techniques are being critically tested this week as the Middle East conflict enters its fourth week, weighing on the global macro landscape across supply routes, energy prices, central bank policy expectations, and overall market sentiment.
Negotiations are attempting to take place; however, given the escalation around nuclear disarmament and broader regime change narratives from both sides, a resolution remains out of sight. This keeps key levels on US Oil and Brent in focus to confirm structural shifts in crude, with ripple effects across global markets.
Key Levels to Watch
- Brent: 110–118 on the upside, 104–97 on the downside
- WTI: 100–115 on the upside, 93–89 on the downside
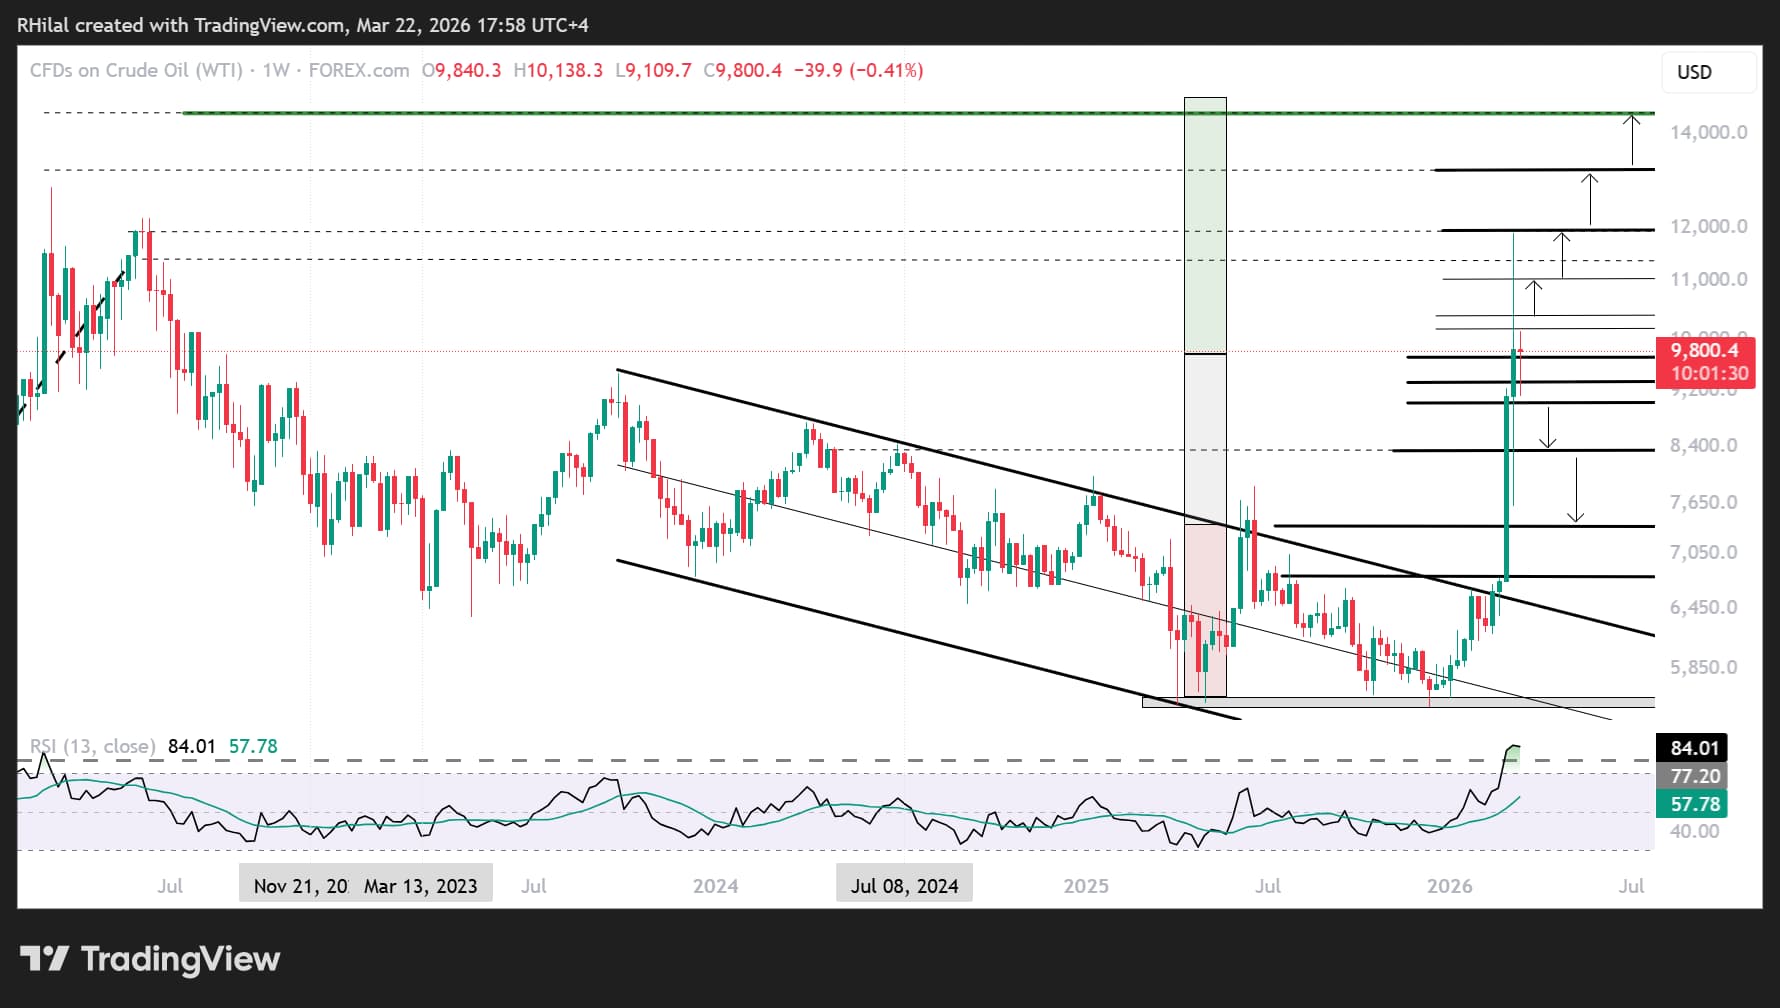
WTI Crude Oil Weekly Outlook – Log Scale
Source: TradingView
WTI price action is currently fluctuating between:
• The 2022 resistance near $120 (Russia–Ukraine invasion)
• The 2023 high near $91, the upper channel boundary
• The June 2025 high near $75 (Iran–Israel–US conflict), now acting as support
These technical zones remain decisive in defining crude oil’s next long-term directional move.
Bullish scenario:
The bullish bias remains evident following the successful defense of the $75 level, which has transitioned from resistance into support, alongside a hold near the $100 level.
• A decisive close above $100 would extend upside targets toward $110–$115
• Beyond that, further bullish expansion could target $130–$150
These projections are derived using the Fibonacci extension tool applied between the 2020 lows, the 2022 highs, and the 2026 lows.
Key Fibonacci alignments:
• 0.618 extension → $115
• 0.786 extension → $130
• 1.000 (100%) extension → $150
Bearish scenario:
A daily close back below the $93–$89 range would extend bearish forecasts toward $80 and the $75 level, the June 2025 breakout zone. This could redirect WTI toward the upper boundary of the 2.5-year descending channel near $66.
Such a move may either trigger another bullish rebound attempt or reintroduce extended consolidation between the $70 and $50 range, aligning with the administration’s broader objectives.
Written by Razan Hilal, CMT
Follow on X: @Rh_waves




