
Key Events This Week
- WTI drops to 62.60 ahead of major geopolitical and economic catalysts: Ukraine ceasefire, U.S.–China tariffs, OPEC report, and U.S. CPI
- Global tariff developments continue to shape sentiment and crude demand valuations, especially in relation to OPEC’s evolving supply strategy
Tuesday, August 12, still stands out as a potentially high-impact day for crude oil, bringing together multiple pressure points for the market: the deadline for a U.S.–China tariff resolution, the release of the OPEC Monthly Report, and the U.S. CPI report — all of which could affect oil prices and reshape Fed rate-cut expectations and dollar positioning.
Meanwhile, attention is also building toward the Trump–Putin summit on Friday, August 15, set to take place in Alaska, where a framework for a Ukraine ceasefire is expected to be discussed. Although the meeting takes place after Tuesday’s events, markets are already pricing in its potential implications — with a bearish tone — in line with broader global tariff risks and OPEC’s production strategy, which includes an increase of 547,000 barrels per day in September.
Price Action Context
As for WTI, it’s currently trading at a key support level that could either spark an early recovery or set the stage for a deeper breakdown back below the $60s zone.
U.S. economic reports have already added downside pressure on crude, and China-related tariff uncertainty could amplify that stress, especially if a deal collapses. In that case, we might see panic pricing and further downside if no deal or retaliation is reported — a move that could shift trade dynamics globally, potentially accelerating the formation of supply chains independent of the U.S. market.
Technical Analysis: Quantifying Uncertainties
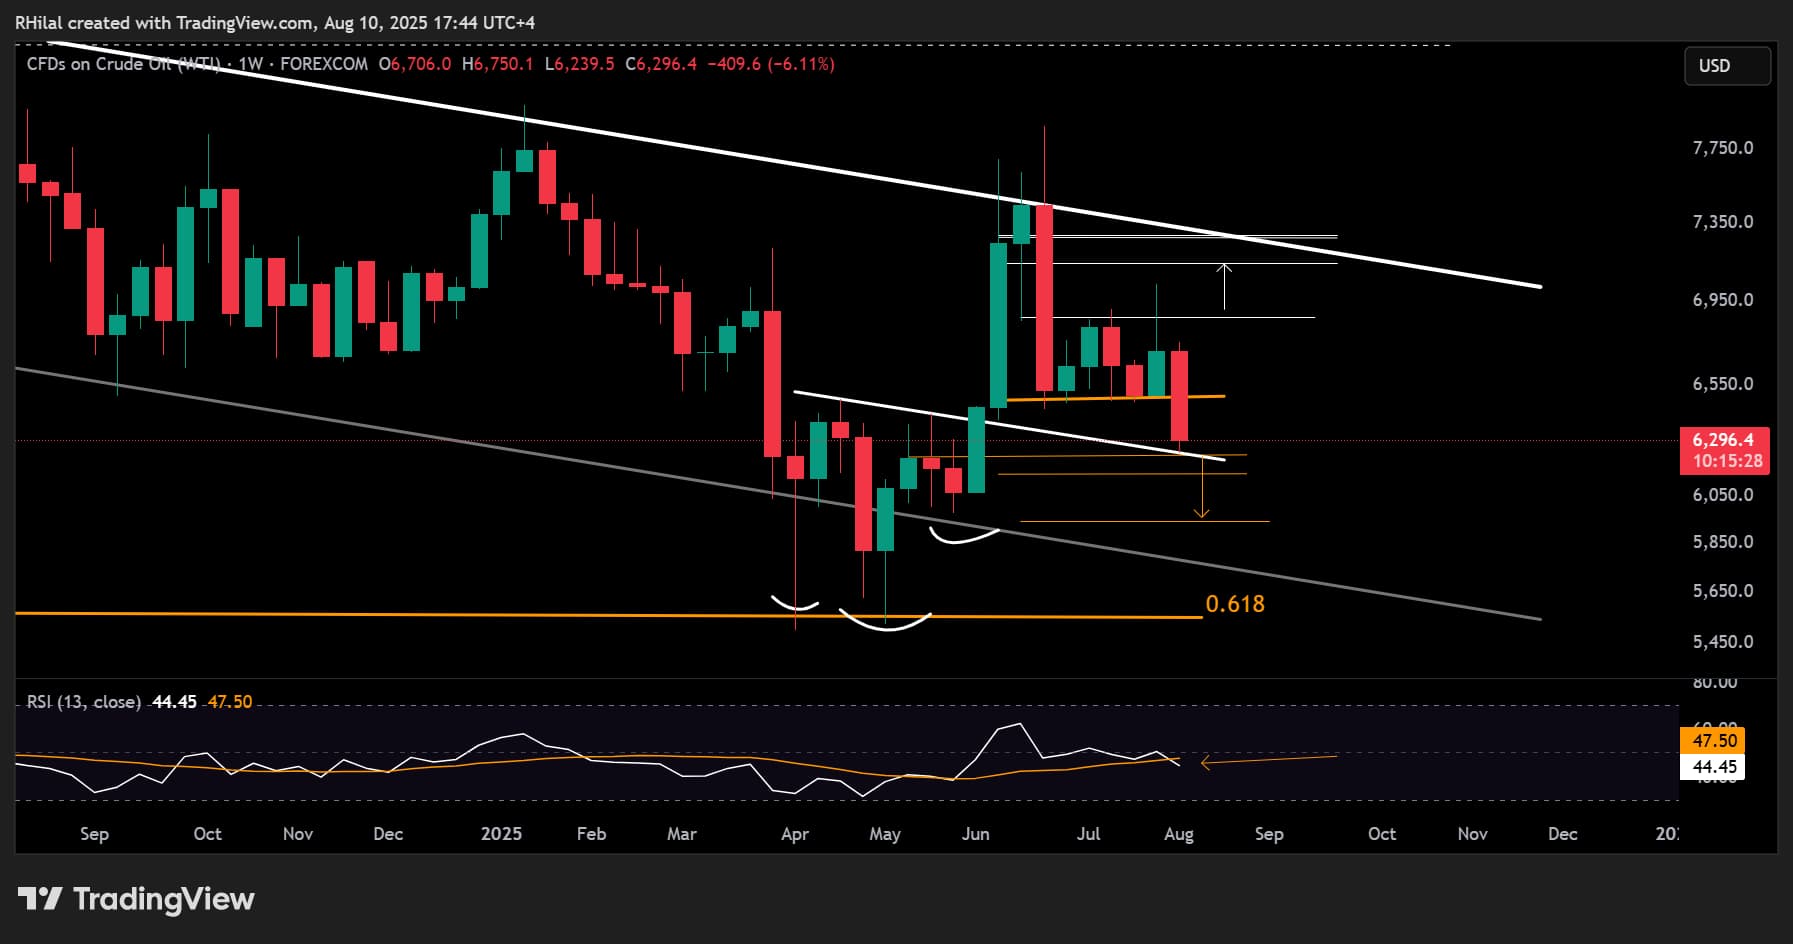
Crude Oil Weekly Outlook: Weekly Time Frame – Log Scale
Source: Tradingview
WTI’s latest drop is currently holding at the 0.618 Fibonacci retracement of the May–June uptrend, and precisely at the neckline of the inverted head and shoulders pattern around the 62.60 level. The Fibonacci retracement was applied from the $55 low to the $77.80 close, filtering out breakout noise from the Iran–Israel escalation outside the borders of the 3-year down trending channel.
- If 62.60 breaks, downside risks may accelerate toward the mid-zone of the channel, with key levels in sight at 61.40, 59.40, and 55.20, respectively.
- If 62.60 holds, and WTI reclaims ground above 65, we could see a recovery toward the upper edge with next resistance levels at 68.00, 70.00, 71.40, and 72.70.
Written by Razan Hilal, CMT
Follow on X: @Rh_waves