
WTI crude oil holds above the $100 mark amid persistent risks surrounding the Strait of Hormuz, supported by constrained supply flows and ongoing inventory drawdowns. This reflects a structural supply constraint rather than a temporary risk premium trade.
The disruption in the Strait has now extended into its ninth week, with previously priced-in risk premiums above $100 per barrel beginning to materialize across global inflation data.
Key drivers supporting crude oil:
- OPEC and Gulf producers are unable to materially increase output until the Strait fully reopens
- Seaborne exports have declined by more than 10 million barrels per day
- US crude inventories fell by 6.2 million barrels, approaching yearly lows and signaling rising pressure on supply
- The UAE’s exit from OPEC after decades of cooperation signals a structural shift in production strategy following one of the largest supply shocks on record
Crude Oil Weekly Outlook: 3 Month Time Frame – Log Scale

Source: Trading view
Crude oil prices have maintained a long-term bullish trend since the 1860s lows, as illustrated on the 3-month timeframe. Price action continues to respect the bounds of a parallel channel, alongside key Fibonacci ratios.
Currently, prices are holding near the mid-zone of this channel and around the 50% Fibonacci retracement of the long-term uptrend, reinforcing crude’s structural bullish bias and highlighting a key continuation zone.
The 50% level, near $120, represents a pivotal threshold. A sustained hold above this level could drive prices toward the upper bound of the channel, aligning with historical resistance levels near $135, $160, and $200.
On the downside, failure to hold this zone could trigger a move lower toward $80 and $60, particularly if supply conditions normalize.
Short term levels are defined below
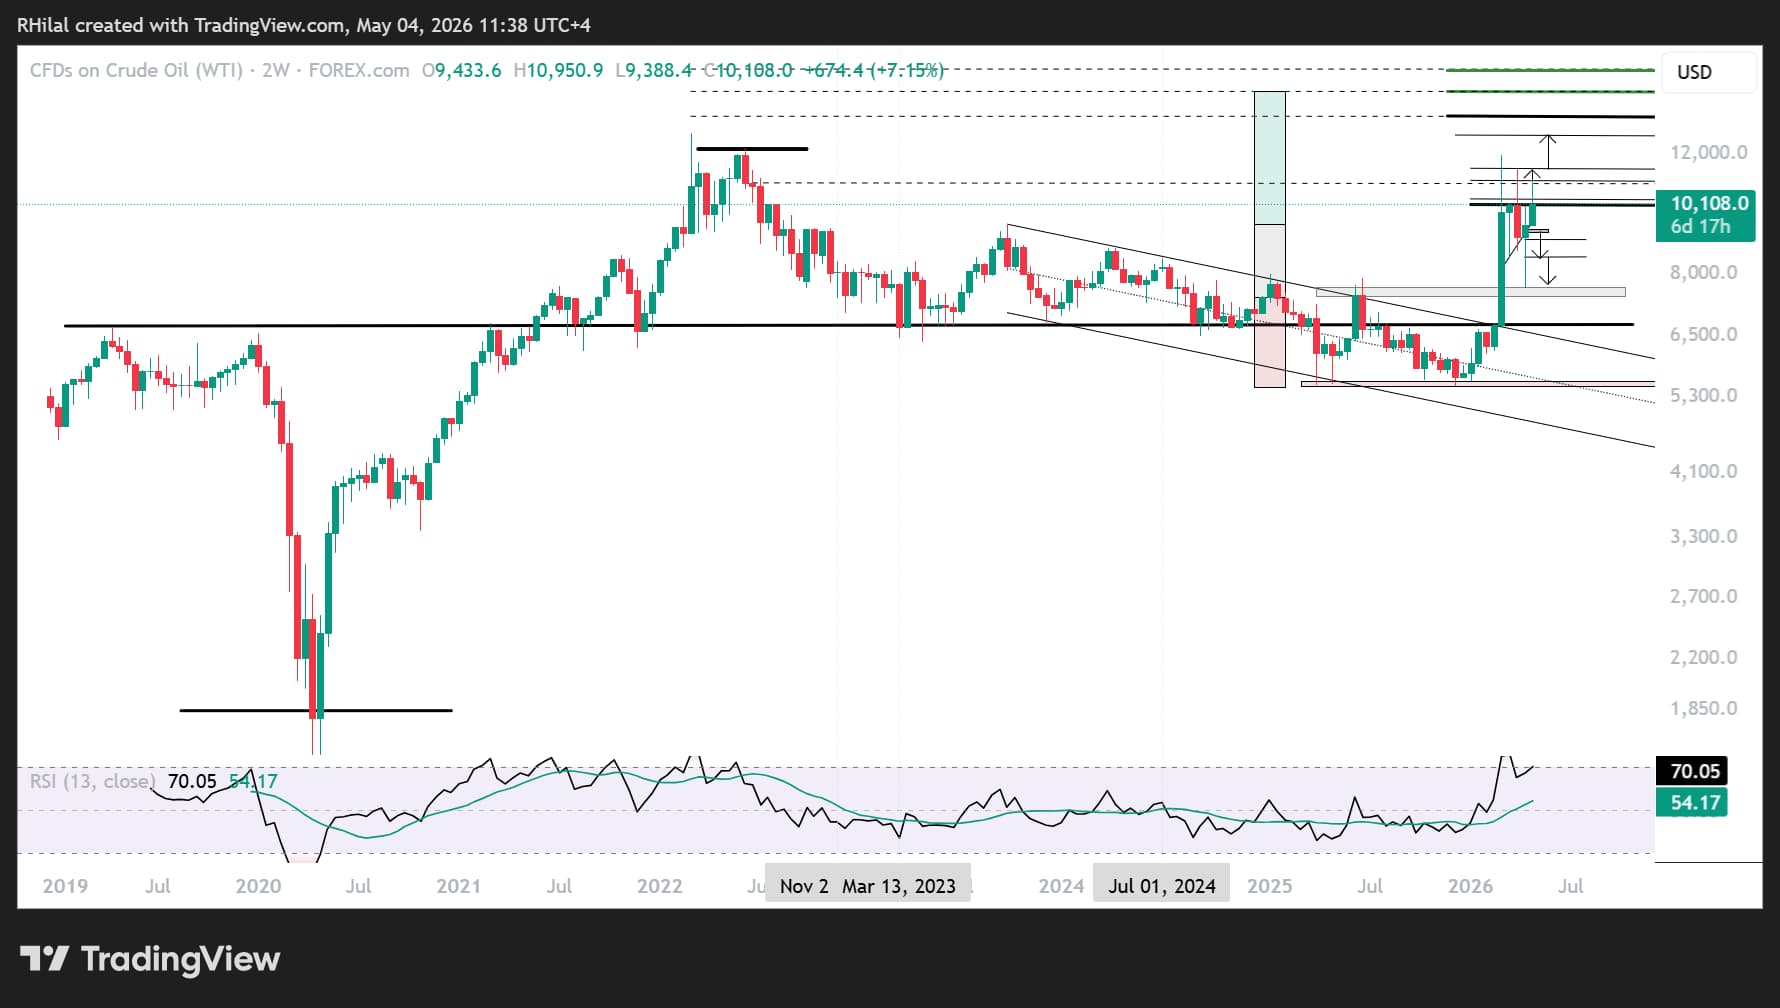
Crude Oil Weekly Outlook: 2Week Time Frame – Log Scale
Source: Trading view
On the shorter timeframe, consolidation below the $100 mark since March 2026 suggests the formation of a potential ascending triangle—a continuation pattern that may support further upside in crude prices.
A confirmed breakout above $115 would expose the $135–$160 range, aligning with Fibonacci extension ratios derived from the 2020, 2022, and 2025 trend structure.
Conversely, downside risks remain in focus. A break below the 2023 highs (88–93), followed by further declines below $82 and $76 (the peak of last year's US-Iran-Israel conflict), could confirm a broader bearish consolidation. This scenario would likely unwind the geopolitical risk premium and push prices back toward the $60 range.
Written by Razan Hilal, CMT
Follow on X: @Rh_waves