


The start of the week has been relatively slow for Dow Jones price action, as the index has shown a decline of around -0.1% in the short term. At this stage, the strong buying momentum seen in previous sessions has not been sustained, giving way to a pause in price movements.
The recent neutrality in the index can be mainly attributed to a slowdown in the increase of risk market confidence, driven by new developments in the Middle East conflict. This context has prevented the index from advancing consistently toward all-time highs, suggesting that a short-term phase of indecision may continue in the coming sessions.

New updates slow down confidence momentum
There are still uncertainties surrounding negotiations between the United States and Iran, particularly after Iran accused the U.S. over the weekend of violating the ceasefire and threatened retaliation. This has raised doubts about the continuity of the negotiation process, and Iran has not yet confirmed participation in future talks.
This situation has also affected expectations for a full reopening of the Strait of Hormuz in the short term, introducing a sense of caution into the markets.
This effect is reflected in confidence indicators such as the Fear and Greed Index, which has paused the strong upward move seen last week near the 70-point level, close to entering the “extreme greed” zone. While this does not indicate a decline in confidence, it does suggest a phase of consolidation as markets assess new developments.
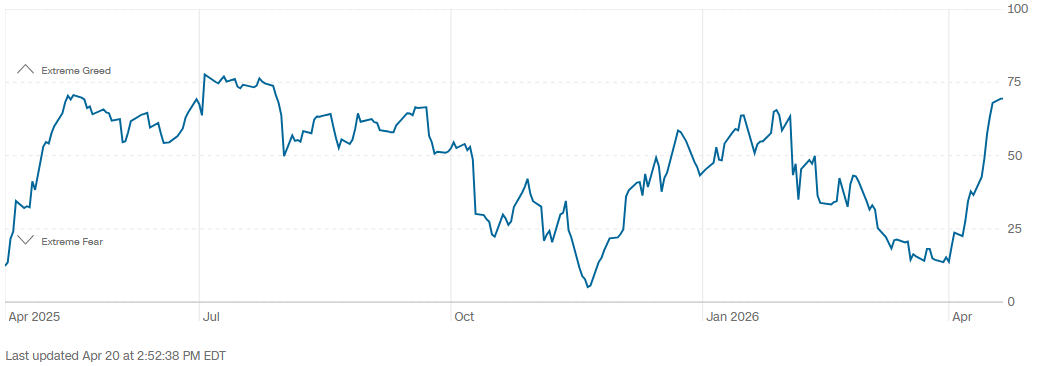
Source: CNN
This environment is also reflected in the performance of key Dow Jones components, which show a mixed performance. Stocks such as Goldman Sachs (+0.89%), Caterpillar (+0.24%), and Home Depot (+0.04%) are posting gains, while others like Microsoft (-1.31%) and Amgen (-0.83%) are trading lower.
This mixed behavior indicates a lack of clear direction in the short term, suggesting that demand for risk assets is currently in a temporary adjustment phase, at least until clearer developments emerge in the Middle East.
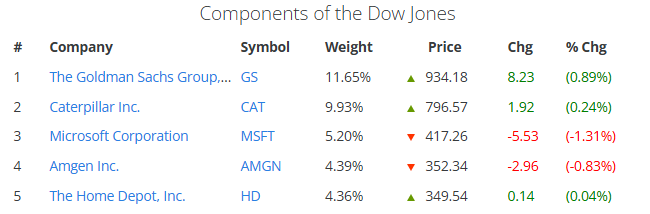
Source: Slickcharts
Despite this short-term pause, it is important to highlight that the accumulated demand from the previous week remains significant. This is reflected in the E-mini Dow Jones futures market, where trading volume reached around 130,000 contracts on April 17, levels not seen since early in the month.
In addition, Open Interest has remained stable, with more than 70,000 open positions, indicating that overall market activity remains consistent. This suggests that, despite the recent pause in price action, the underlying demand structure remains in place and could become relevant again if confidence improves.

Source: CMEGROUP
In this context, recent uncertainty has led to a pause in market momentum, but the underlying demand base remains solid. If meaningful progress in negotiations emerges, it is likely that confidence will recover, potentially supporting a renewed upward move in the Dow Jones in the coming weeks.
Dow Jones Technical Outlook
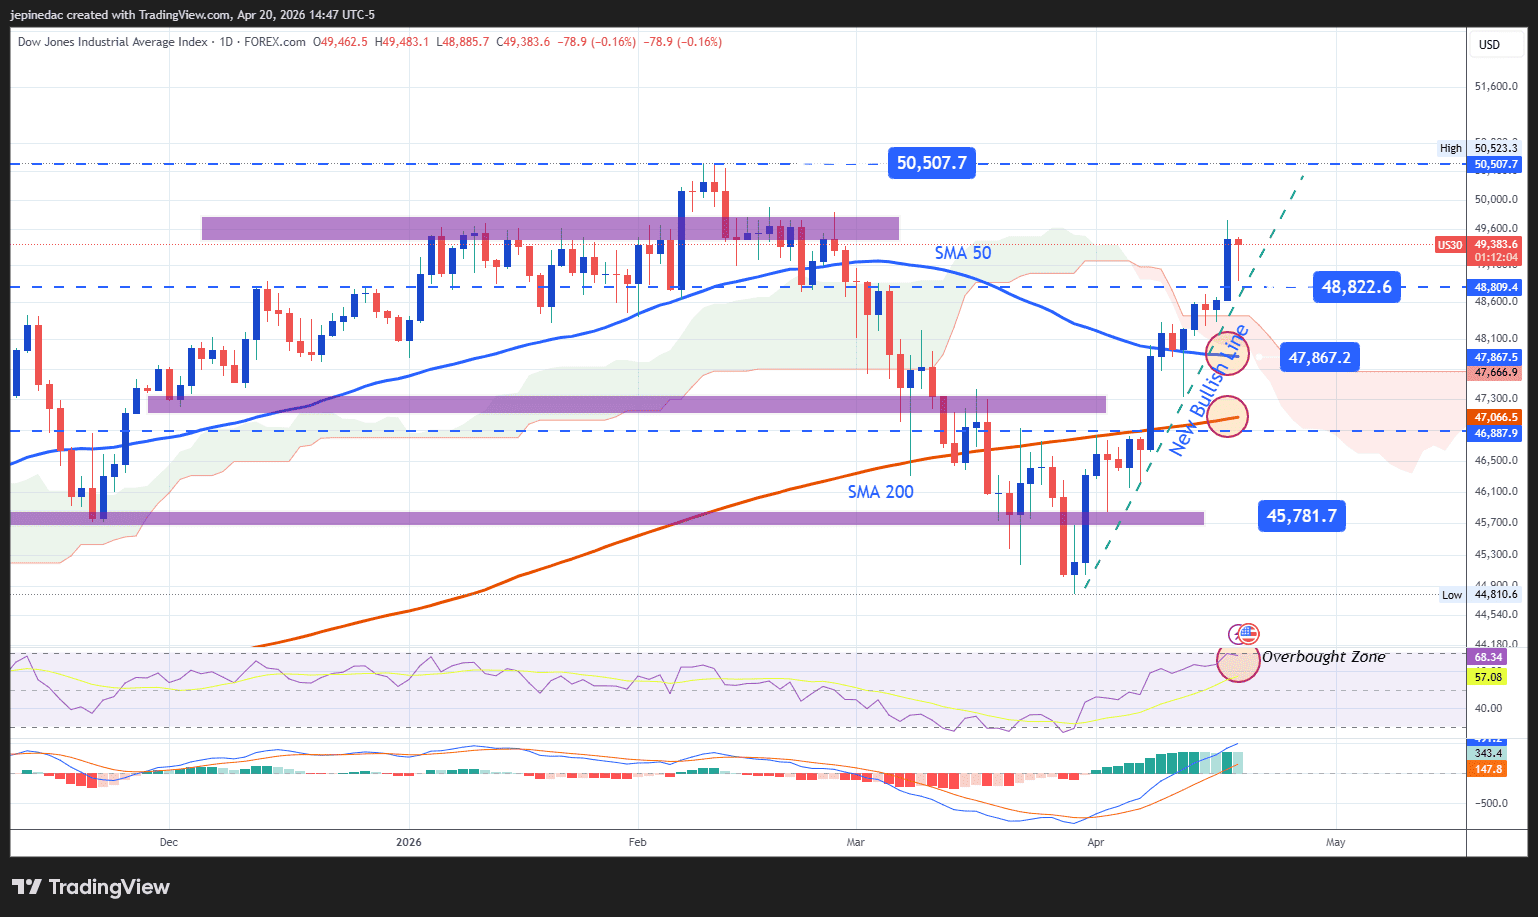
Source: StoneX, Tradingview
- A new trend begins to emerge: Since late March, the Dow Jones has shown a consistent recovery, forming higher lows, which suggests the development of a potential short-term upward trendline. Although recent movements show a mild correction, it is not yet sufficient to break the bullish structure, indicating that this formation may continue to be relevant in the near term.
- RSI: The RSI remains above the 50 level, indicating that buying momentum continues to dominate. However, the indicator is gradually approaching the overbought zone (70), suggesting a possible excess in bullish momentum that could open the door for short-term corrections.
- MACD: The MACD histogram is beginning to flatten, indicating that while short-term moving average momentum remains bullish, it may be entering a phase of consolidation, reinforcing the potential for corrective movements.
Key levels:
- 50,500 points – Key resistance: The all-time high zone and the main upside barrier. A move toward this level could reinforce the bullish bias and support the continuation of the short-term uptrend.
- 48,800 points – Near-term barrier: A key technical level that may act as a reference in the event of short-term pullbacks.
- 47,800 points – Key support: A support zone aligned with the 50-period moving average. A move toward this level could put the current bullish structure at risk and lead to a more sustained phase of indecision in the coming weeks.
Written by Julian Pineda, CFA, CMT – Market Analyst
Follow him on:: @julianpineda25



