
Key Events
- Geopolitical tensions have given 2026 an early and cautious start, limiting rally potential across equity indices so far and keeping safe havens in focus.
- The Dow recorded a new high near 49,300 before quickly pulling back toward the 48,000 range, reflecting constrained risk appetite and the presence of key resistance levels.
- Momentum across indices has slowed relative to 2025, following an extreme year of policy shifts, price moves, and headline-driven volatility. This warrants caution for a potential corrective phase before the primary uptrend resumes.
- High volatility risk potential : US NFP report on Friday
In my previous Trades to Watch in 2026 – Dow Jones Article, I highlighted the recurring cycle equity indices often experience during a president’s second year in office. Historically, sharp policy shifts are frequently followed by consolidation phases, allowing markets to reset before resuming their primary trend.
Given Trump’s aggressive policy changes throughout 2025, including tariffs and dovish pressures from the Federal Reserve, concerns surrounding Fed independence during this year’s elections are also increasing. These risks heighten inflation concerns should rate cuts materialize faster than anticipated, contributing to a more uncertain outlook for interest rates and broader financial markets as we move into 2026.
Beyond the Dow’s contracting structure, the Nasdaq is displaying a notable divergence relative to both the Dow and the S&P 500. The index has failed to record new highs since October 2025, raising questions around AI and technology valuations, as well as the sustainability of investment appetite in the sector amid an increasingly uncertain geopolitical backdrop heading into 2026.
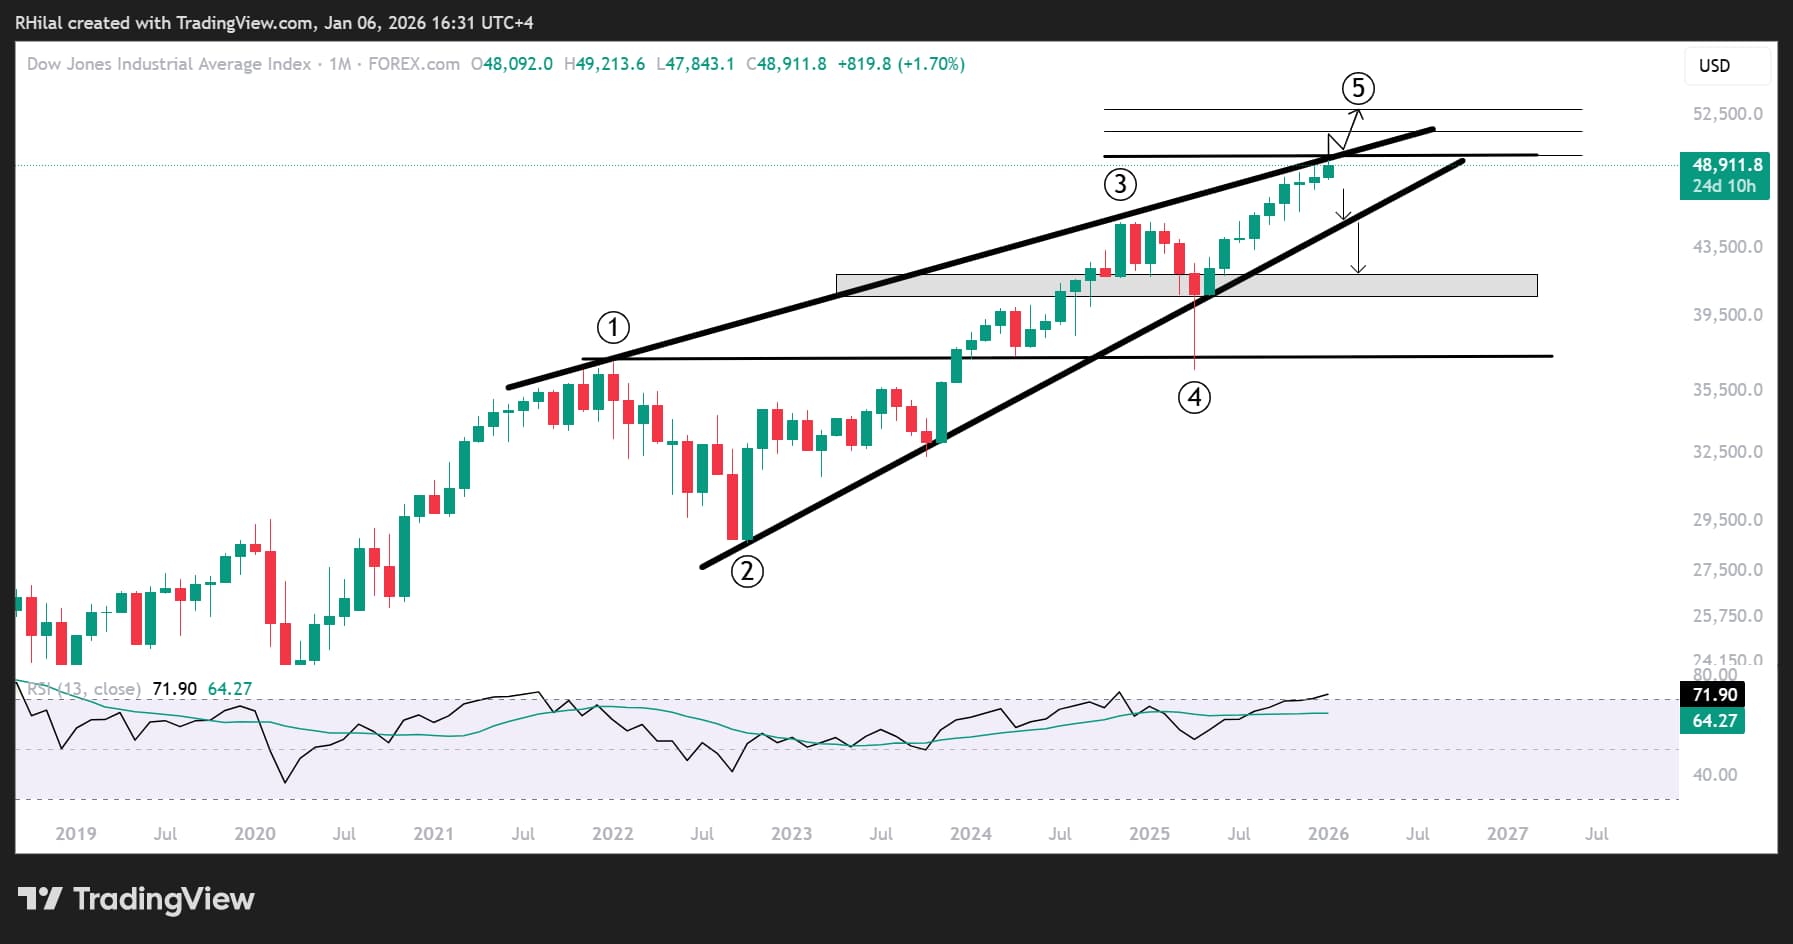
Dow Jones Forecast: Monthly Time Frame – Log Scale
Source: Trading view
Zooming out to the monthly time frame, a clear contracting price structure emerges, connecting consecutive higher highs from January 2022, November 2024, and December 2025. This diagonal-like formation increases the risk of sharper price scenarios as the Dow approaches the 50,000-threshold.
Should a clean breakout above the 50,000 level occur, price extensions toward 51,300 and 53,000 become likely. These targets are derived using the Fibonacci extension tool, measured from the September 2022 low to the November 2024 high, and projected from the April 2025 low.
On the downside, in line with overbought monthly RSI conditions and a trendline connecting higher highs between 2022 and 2025, a sustained move below 48,000 could extend corrective projections toward 45,000 and potentially 40,500. Such a scenario would likely coincide with a broader market pullback or corrective phase before the longer-term uptrend resumes.
Written by Razan Hilal, CMT
Follow on X: @RH_waves