TSMC sales figures
TSMC is due to release its monthly sales figures next week, days after it revealed that it will invest $100 billion into the US, expanding on its existing $65 billion investment in the country.
Last week's announcement laid out plans for what is expected to be its largest single foreign direct investment in U.S. history. The company plans new manufacturing plants, two advanced packaging facilities, and a major research and development centre. Over 40,000 construction jobs are expected to be created over the coming four years, in addition to tens of thousands of jobs in chip manufacturing and R&D.
Despite this latest announcement, shares are down over 3% over the past week as Trump's trade tariff plans created uncertainty in the chip sector. TSMC's revenue in January rose 36% to $293.3 billion Taiwan dollars. However, as a result of earthquake damage TSMC forecast revenue for Q1 to be closer to the lower end of the range of $25 billion to $25.8 billion.
How to trade TSM sales figures?
After reaching an all-time high of 226, the price rebounded lower, breaking below the 50, 100, and 200 SMAs, falling to a five-month low of 170, the October 1 low. Sellers supported by the RSI below 50 would look to take out this level to extend the sell-off to 156.00.
Should this support hold, buyers would need to recover above the 200 SMA at 183.00. A rise above here could see buyers gain momentum.

Oracle Q3 Earnings Preview
Oracle, which provides products and services for corporates, including cloud and on-premises applications and infrastructures, is expected to announce fiscal Q3 earnings on Monday after the market close. Investors will be watching to see if there is a similar reaction to its Q2 earnings, after which the stock surged to $155.
In Q2, Oracle posted a 9% annual increase in total revenue to $14.1 billion amid a 24% rise in cloud revenue. Strong growth is expected in the upcoming numbers, with Stargate AI expected to drive growth. Stargate AI is Oracle's cooperation with Open AI in Nvidia to build and operate advanced computing systems.
How to trade ORCL earnings?
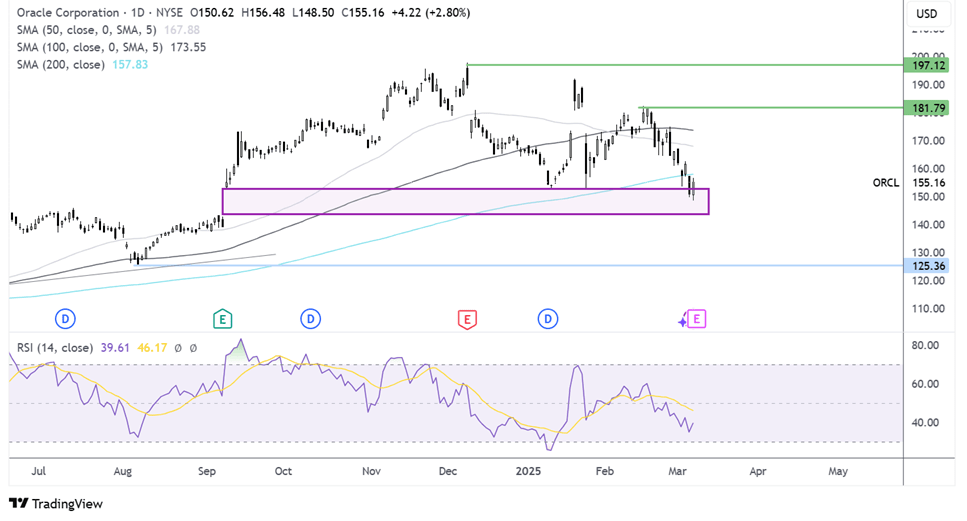
The price has seen choppy action after reaching a record high of 197 at the end of last year. Since the February 20 high of 182, the price has been trending lower, breaking below the 200 SMA, but once again, it is testing support for the September gap between 144 and 152.
Should sellers, supported by the RSI below 50, take out this support, a sell-off towards 125.00, the August low, will occur.
Should this support hold, buyers will look to rise above the 200 SMA at 157 and the 50 SMA at 167. A rise above 182.00 would create a higher high.
Persimmon full-year results preview
Housebuilder Persimmon has already given investors some insight as to what to expect from full-year results following a trading update in January. Persimmon said completions were up 7% year on year at 10,664 homes, which beat expectations.
Meanwhile, it also said that full-year underlying profit before tax for 2024 was expected to be at the upper end of market expectations, with guidance of £349 million to 390 million.
Persimmon also revealed an encouraging start to 2025, with an improved forward order book and strong land bank.
However, evolving macroeconomic uncertainties and uncertainties surrounding the timing of future interest rate cuts may impact the market. With UK inflation up at 3% and expected to rise to 3.7% by Q3, the BoE could adopt a more cautious approach to rate cuts. This could slow the mortgage market.
The results came after the Halifax house price index showed that house prices fell 0.1% month over month in February, and after the construction, PMI showed significant weakness.
How to trade PSN results?
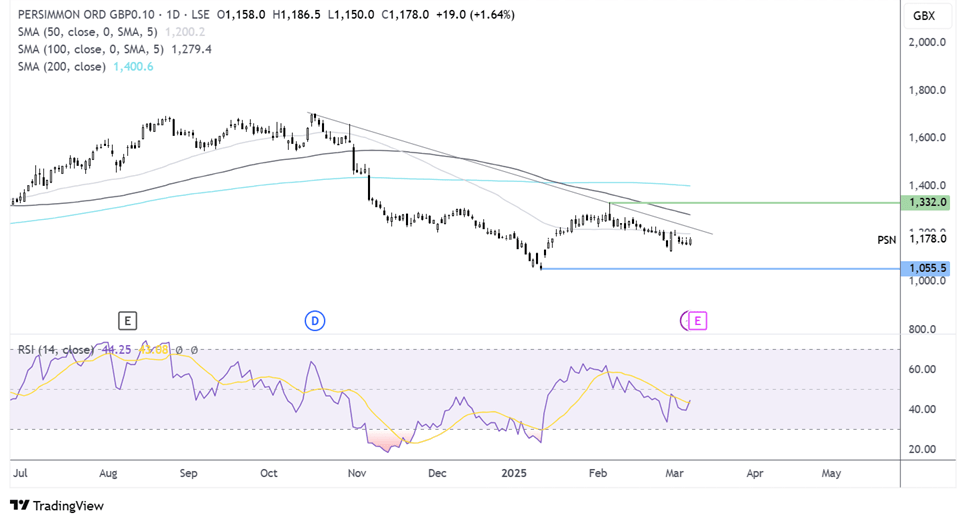
Persimmon has been trending lower since October last year. The price ran into support at 1050, before recovering to 1330 and easing again to 1180. The price trades below the 50, 100 & 200 SMA but would need to take out support at 1120, the February low to retest 1050 and create a lower low.
Should buyers rise above 1215, the falling trendline, 1275, the 100 SMA, 1330 comes into focus. A rise above here creates a higher high, exposing the 200 SMA at 1400.