


- EUR/CHF drops over two big figures in October
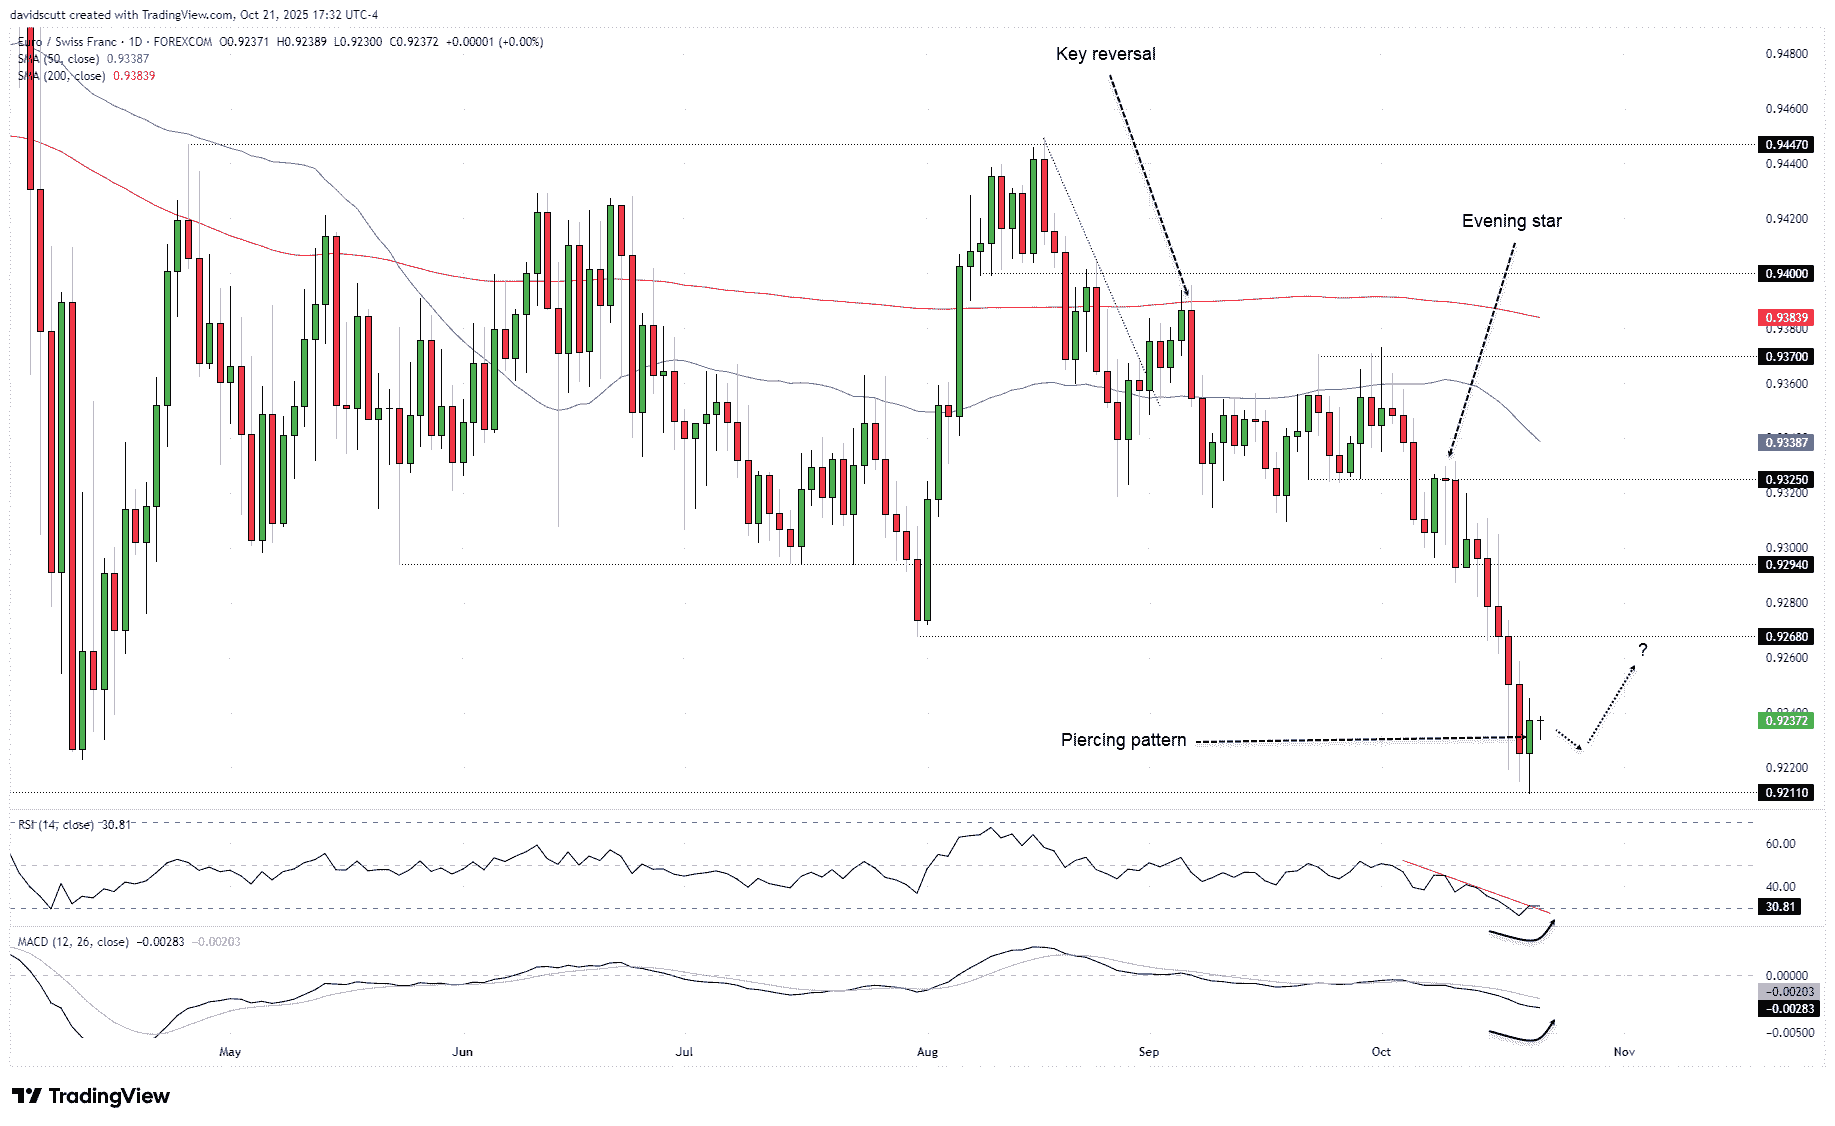
- Piercing pattern formed at major support
- RSI downtrend broken, MACD curling toward signal line
- Upside targets: .9286, .9294, .9325
Summary
Oversold and arguably under-loved, EUR/CHF was always at risk of a short-term bounce after the shellacking seen over much of October, seeing the pair slide over two big figures, which is a lot for the traditionally lower beta FX pair. However, having produced an obvious bullish reversal on Tuesday, the seeds may just have been sown for something potentially more substantial than a dead cat bounce.
EUR/CHF Delivers Reversal Pattern from Key Support
Source: TradingView
The daily chart above tells the story, with Tuesday’s candle delivering a piercing pattern, gapping lower on the open before setting fresh cyclical lows only to reverse sharply higher into the close, finishing the session more than halfway up the prior day’s ugly bearish bar. The pattern is often seen at turning points, signalling we may have seen the lows for now. However, making this signal potentially more trustworthy than usual, it came from an important support zone where the price bounced violently in August 2024 and again three months later. Given the price action around .9211, it perhaps comes as no surprise that we saw another savage reversal from just above the level in April this year, coinciding with peak trade tensions following the Liberation Day market massacre.

So, this bullish reversal pattern has caught the eye, especially as EUR/CHF has recently tended to follow through when a reversal signal has printed, as annotated on the chart. Those interested in positioning for a reversal could wait for a pullback towards .9211 before establishing longs, although the opportunity may not arise given the signal that’s been delivered. Entry could still be around these levels, although it would likely need to target higher prices to make the trade stack up from a risk-reward perspective. A stop beneath .9211 would provide protection against reversal.
As for long targets, the July low of .9286 is the first level of note, with .9294 and .9325 others that saw ample price action either side earlier this year. The 50-day moving average may prove to be a tougher test should the price return there, notable for just how often it’s consecutively capped and supported the pair for lengthy periods in the past.
Both RSI (14) and MACD continue to deliver firm bearish signals, which would normally favour selling into strength. We’re therefore going against the grain with this one, although it’s notable that RSI (14) has broken the downtrend it was in over recent months, pulling out of oversold territory as a consequence. MACD is also showing signs of curling back towards the signal line, hinting bearish pressure may be at or past its peak.




