
US Dollar Forecast: EUR/USD
The recent rally in EUR/USD seems to be stalling ahead of the September 2021 high (1.1909) as it falls for the first time in two weeks, but the weakness in the exchange rate may turn out to be temporary as the Relative Strength Index (RSI) still holds in overbought territory.
EUR/USD Pulls Back While RSI Holds in Overbought Zone
EUR/USD seems to be defending the advance from the start of the week as it registers a fresh yearly high (1.1830), and the exchange rate may continue to carve a series of higher highs and lows as long as the RSI sits above 70.
US Economic Calendar
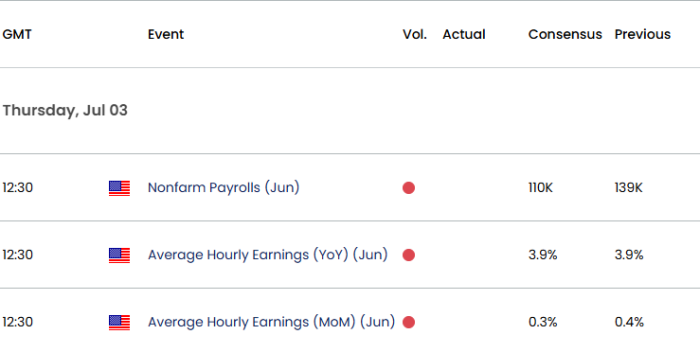
However, data prints coming out of the US may sway EUR/USD as the Non-Farm Payrolls (NFP) report is anticipated to show the economy adding 110K jobs in June following the 139K expansion the month prior, and little indications of a looming recession may keep the Federal Reserve on the sidelines as Chairman Jerome Powell tells US lawmakers that ‘we are well positioned to wait to learn more about the likely course of the economy before considering any adjustments to our policy stance.’
Join David Song for the Weekly Fundamental Market Outlook webinar. David provides a market overview and takes questions in real-time. Register Here
In turn, signs of a resilient labor market may generate a bullish reaction in the Greenback as it encourages the Federal Open Market Committee (FOMC) to retain the current policy, but a weaker-than-expected NFP print may keep EUR/USD afloat as it fuels speculation an imminent Fed rate-cut.
With said, EUR/USD may continue to track the positive slope in the 50-Day SMA (1.1404) as it still holds above the moving average, but the Relative Strength Index (RSI) may show the bullish momentum abating if it struggles to hold above 70.
EUR/USD Chart – Daily
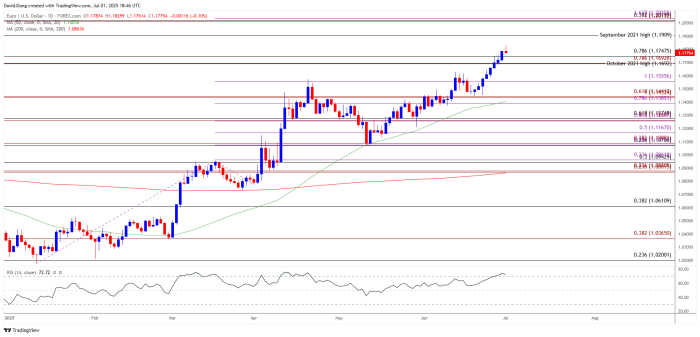
Chart Prepared by David Song, Senior Strategist; EUR/USD on TradingView
- EUR/USD continues to carve a series of higher highs and lows after clearing the October 2021 high (1.1692), with a breach above the September 2021 high (1.1909) opening up the 1.2010 (100% Fibonacci extension) to 1.2040 (161.8% Fibonacci extension) zone.
- Next area of interest comes in around 1.2230 (78.6% Fibonacci extension), but lack of momentum to hold above the 1.1690 (78.6% Fibonacci extension) to 1.1750 (78.6% Fibonacci retracement) zone may push EUR/USD back towards 1.1560 (100% Fibonacci extension).
- Failure to hold above the 1.1390 (78/6% Fibonacci extension) to 1.1440 (61.8% Fibonacci extension) region may lead to a test of the June low (1.1347), with the next area of interest coming in around 1.1260 (61.8% Fibonacci extension) to 1.1280 (61.8% Fibonacci retracement).
Additional Market Outlooks
Australian Dollar Forecast: AUD/USD Eyes November High
British Pound Forecast: GBP/USD Coils Ahead of July
Canadian Dollar Forecast: USD/CAD Tumbles Toward June Low
USD/CHF Selloff Stalls to Keep RSI Out of Oversold Zone
--- Written by David Song, Senior Strategist
Follow on Twitter at @DavidJSong