
Euro, EUR/USD Talking Points:
- EUR/USD bears had an open door to run last week following the fresh lows after the US CPI report, but the threat to fire Jerome Powell stalled the USD advance and since then EUR/USD has pushed back up to a key Fibonacci level.
- The question now is whether sellers come in to defend the resistance levels that held the advance in-check during early-Q3 trade; and I look at the matter from a shorter-term perspective below.

Deduction is an important aspect of market analysis because what doesn’t happen when it probably should have can highlight what might be around the next corner. It can also help to illustrate themes or drivers and what market participants are really looking for at that point in time. In EUR/USD, the pair came into Q3 and the second-half of the year in an overbought state on both the weekly and daily charts. Correspondingly, USD was oversold in a similar manner following an elongated trend through most of the first-half of the year. So, a pullback to start the quarter wasn’t all too surprising, and that theme even continued through last week’s CPI report.
In that data U.S. inflation continued to show signs of moving up and again, this was a theme that carried with it bullish potential in the USD. The initial reaction was even bullish, and that ran through the next 24 hours. But, a day later a circulating threat that President Trump would fire Jerome Powell helped to reverse that move, and a week later the USD is still struggling to get back into that prior up-trend.
In EUR/USD, the pair has already pushed up to a massive spot at 1.1748, which is the 78.6% retracement of the 2021-2022 major move. The 76.4% marker of that same move was in as support to start this week, which bulls showed a strong reaction to. That also provides a type of line-in-the-sand, where a break below would illustrate bears re-taking control of the near-term trend but until that happens, there’s higher-highs and higher-lows that illustrate bullish control from last week’s lows.
EUR/USD Four-Hour Price Chart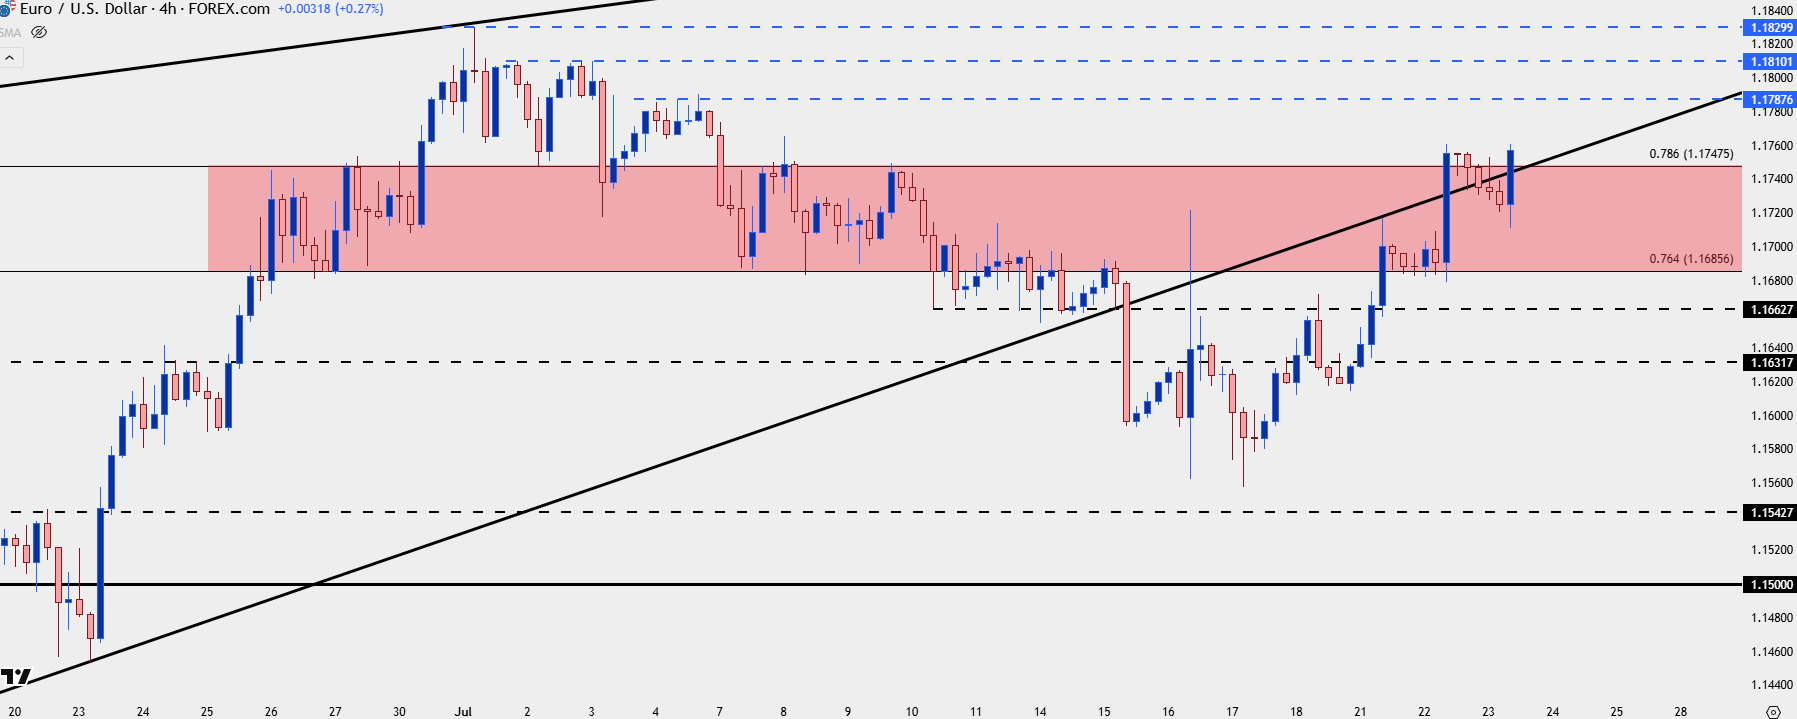
Chart prepared by James Stanley; data derived from Tradingview
EUR/USD Daily
From the daily chart bears can still have a chance here, largely driven by the rising wedge break from last week which, until the highs are taken out, keeps the door open for a lower-high after last week’s lower-low.
The big question is whether there’s enough capital on the sidelines that can come into push this trend-higher, perhaps as high as the 1.2000 psychological level, and that speaks to the overbought reading that was showing on the weekly chart as we came into Q3 trade. That has eased a bit, but logically there’s probably still a heavy net long position sitting in the market as given how long that trend has ran, and that’s what highlights points of interest sitting overhead.
Above the 1.1748 level that’s being tested right now, there’s resistance potential at groupings of prior daily highs, at 1.1788, 1.1810 and then the current three-year high at 1.1830; which, if broken, opens the door for bullish continuation scenarios towards the 1.2000 psychological level.
EUR/USD Daily Price Chart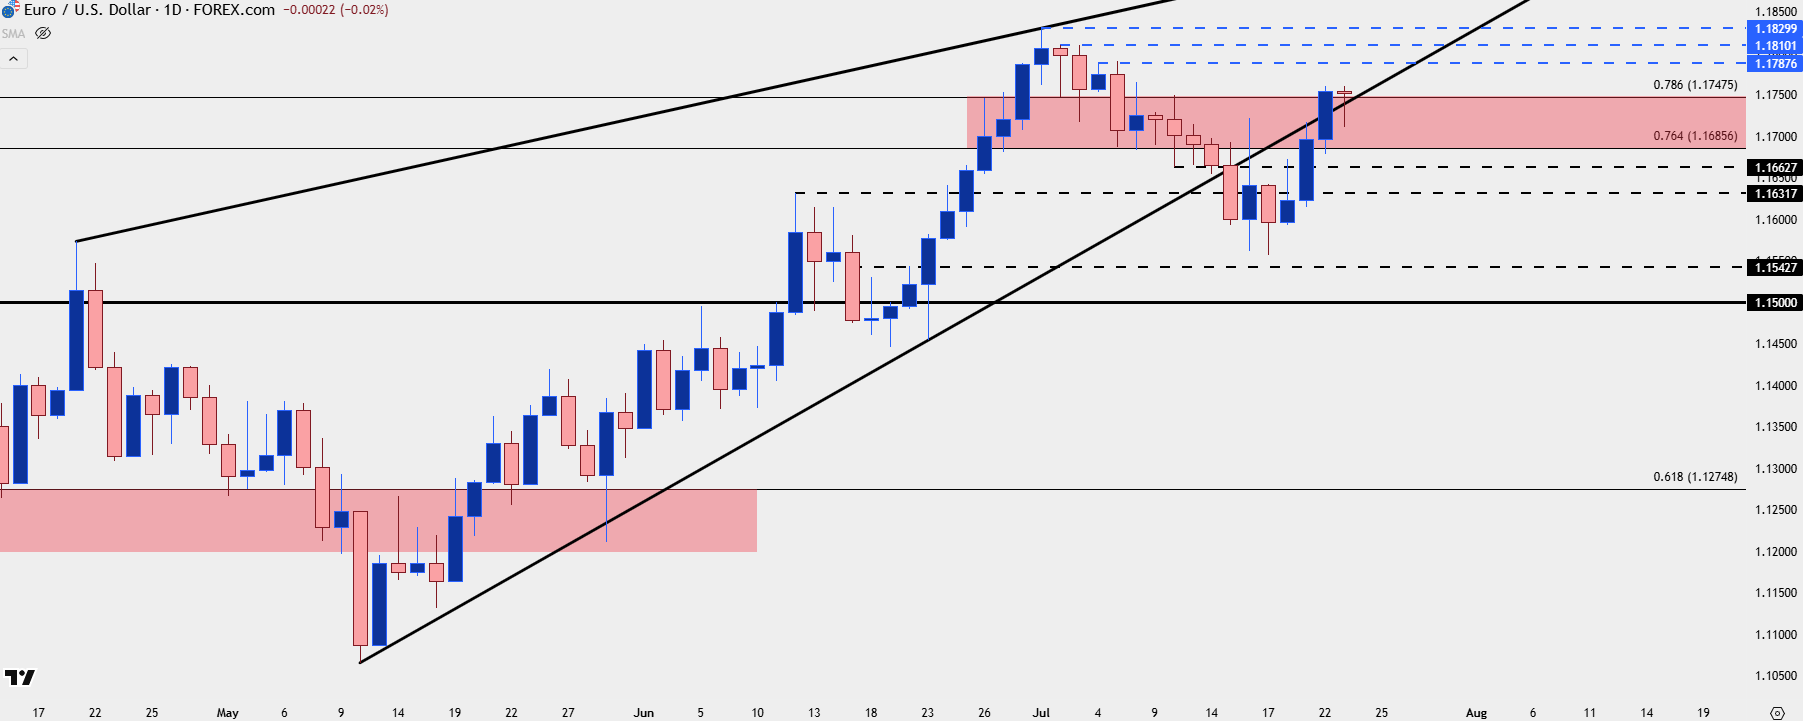
Chart prepared by James Stanley; data derived from Tradingview
--- written by James Stanley, Senior Strategist