
EUR/USD Talking Points:
- After an aggressive rally in the first half of the year, EUR/USD spent Q3 in a state of stall and since the Q4 open, has started to turn-lower.
- Last year saw a similar scenario, as USD sold off ahead of a widely-expected rate cut from the Fed, and this helped to boost EUR/USD. But the Q4 open ushered in a decisive state of change as the Dollar reversed into a rally and EUR/USD tanked by more than 1,000 pips over the next three-and-a-half months.
- EUR/USD is front-and-center for each weekly webinar, and you’re welcome to join the next. Click here to register.

It was a strong first half of the year for EUR/USD but that backdrop began to shift in Q3. This was as markets were gearing up for the Fed to start rate cuts and like we saw last year, it’s the pricing in of those rate cuts that can be most impactful. That doesn’t necessarily mean that the trend has to continue once the cut is announced, however, and again last year illustrates that well. The USD found a low around the rate cut announcement in September of 2024, and then as we moved into Q4 a reversal began to show that soon saw a strong USD trend take over.
This had impact in EUR/USD, as well, as the pair was pushing up to resistance at the 1.1212 level until, eventually, a reversal took over and drove through Q4 and into the 2025 open.
For this Q3, however, that bullish trend in the Euro was already well-priced. A combination of recessionary fears in the US and a persistent President Trump beating the drum for the Fed to cut rates, to the point where Fed members slowly but surely opened up to the idea, and the USD saw its largest half-year sell-off in more than 33 years. But it was the low in April in USD that stood out because that’s where the move began to show symptoms of stall.
In EUR/USD, bulls continued to push, albeit in a less aggressive manner. As we got into Q3, however, buyers were showing more and more trepidation at highs. They were still somewhat aggressive on pullbacks or at lows, as illustrated by the underside wicks on the weekly chart through August and September. But – for a healthy bullish trend there also needs to be buyers pushing through fresh highs to continue the higher-high and higher-low sequencing. It’s when that doesn’t happen that matters begin to shift.
I looked at this from the perspective of the USD yesterday and today, we can see the mirror image of that in EUR/USD. Bulls had an open door to run with the trend, particularly around the September rate cut this year, but they’ve continually shied away from fresh highs, leading to the build of a rising wedge pattern. Rising wedges, like falling wedges, are often approached with aim of reversal from the deduction that the trend-side move is getting long in the tooth.
This week is when sellers in EUR/USD have started to make more of a statement in the pair.
EUR/USD Weekly Chart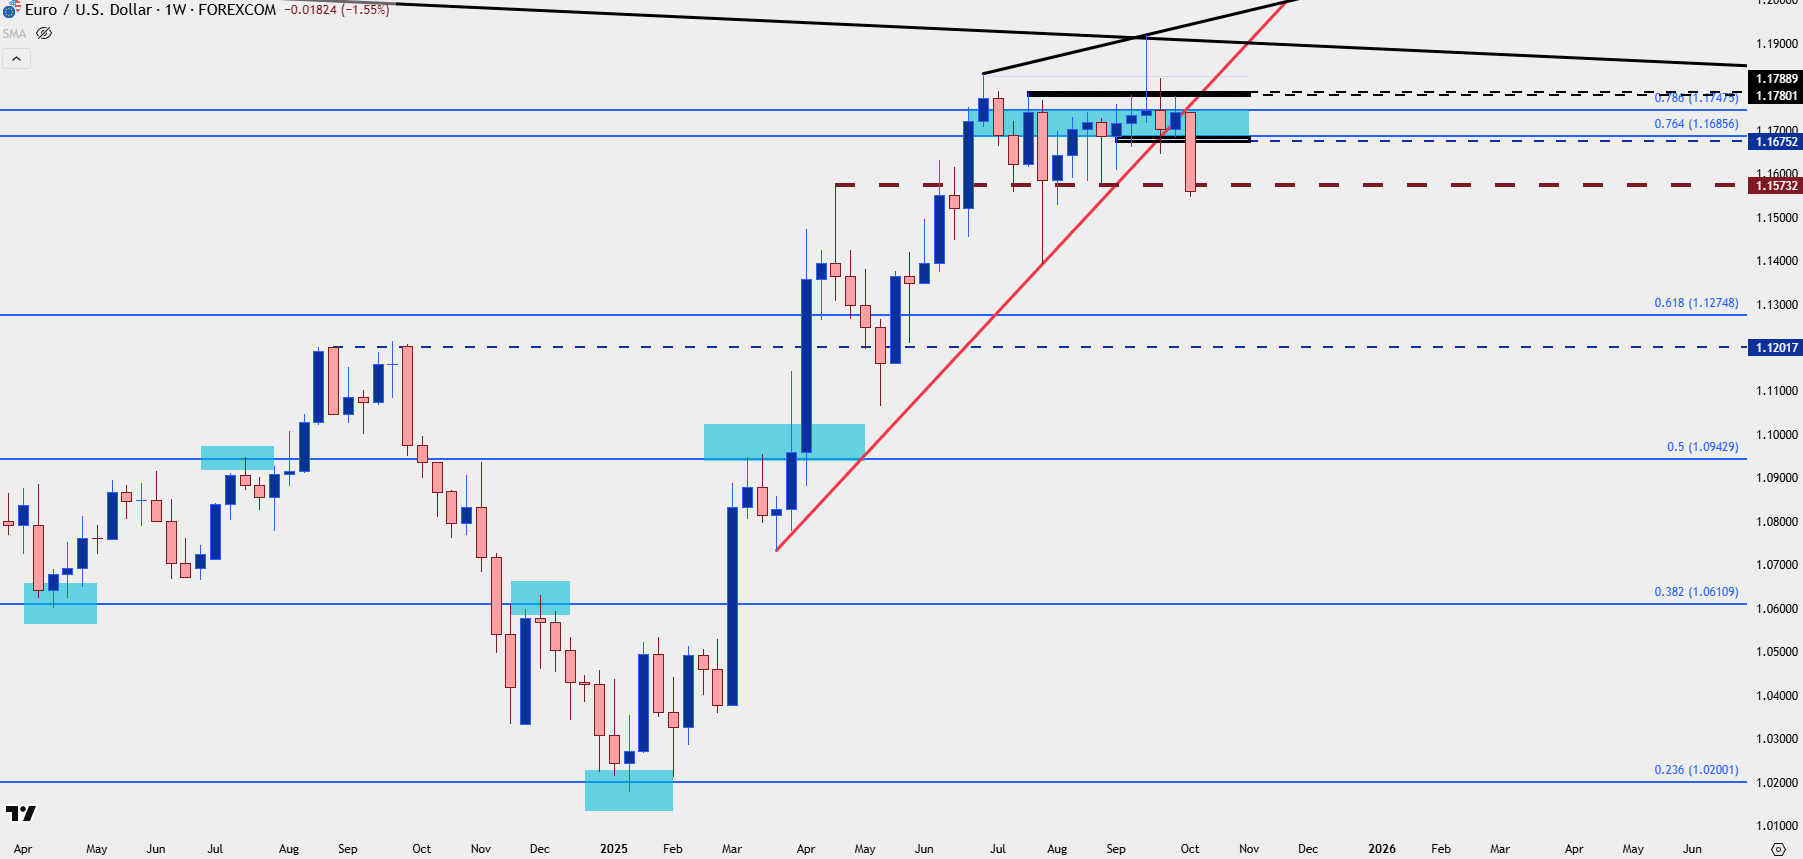
Chart prepared by James Stanley; data derived from Tradingview
EUR/USD Shorter-Term
I’ve follows this theme closely as I continue to believe that dynamics in the Euro are the key for trends around the USD; and the ‘buy the rumor, sell the news’ reaction in EUR/USD has illustrated potential for a scenario resembling what happened last year, when the USD rallied even as the Fed cut rates.
There’s been lower-high and lower-low sequencing ever since that rate cut announcement and today brings another push down to a fresh lower-low, as EUR/USD is currently trading at a fresh two-month-low. And on a shorter-term basis, the bearish trend can retain potential for sellers looking to work with continuation scenarios.
EUR/USD Daily Chart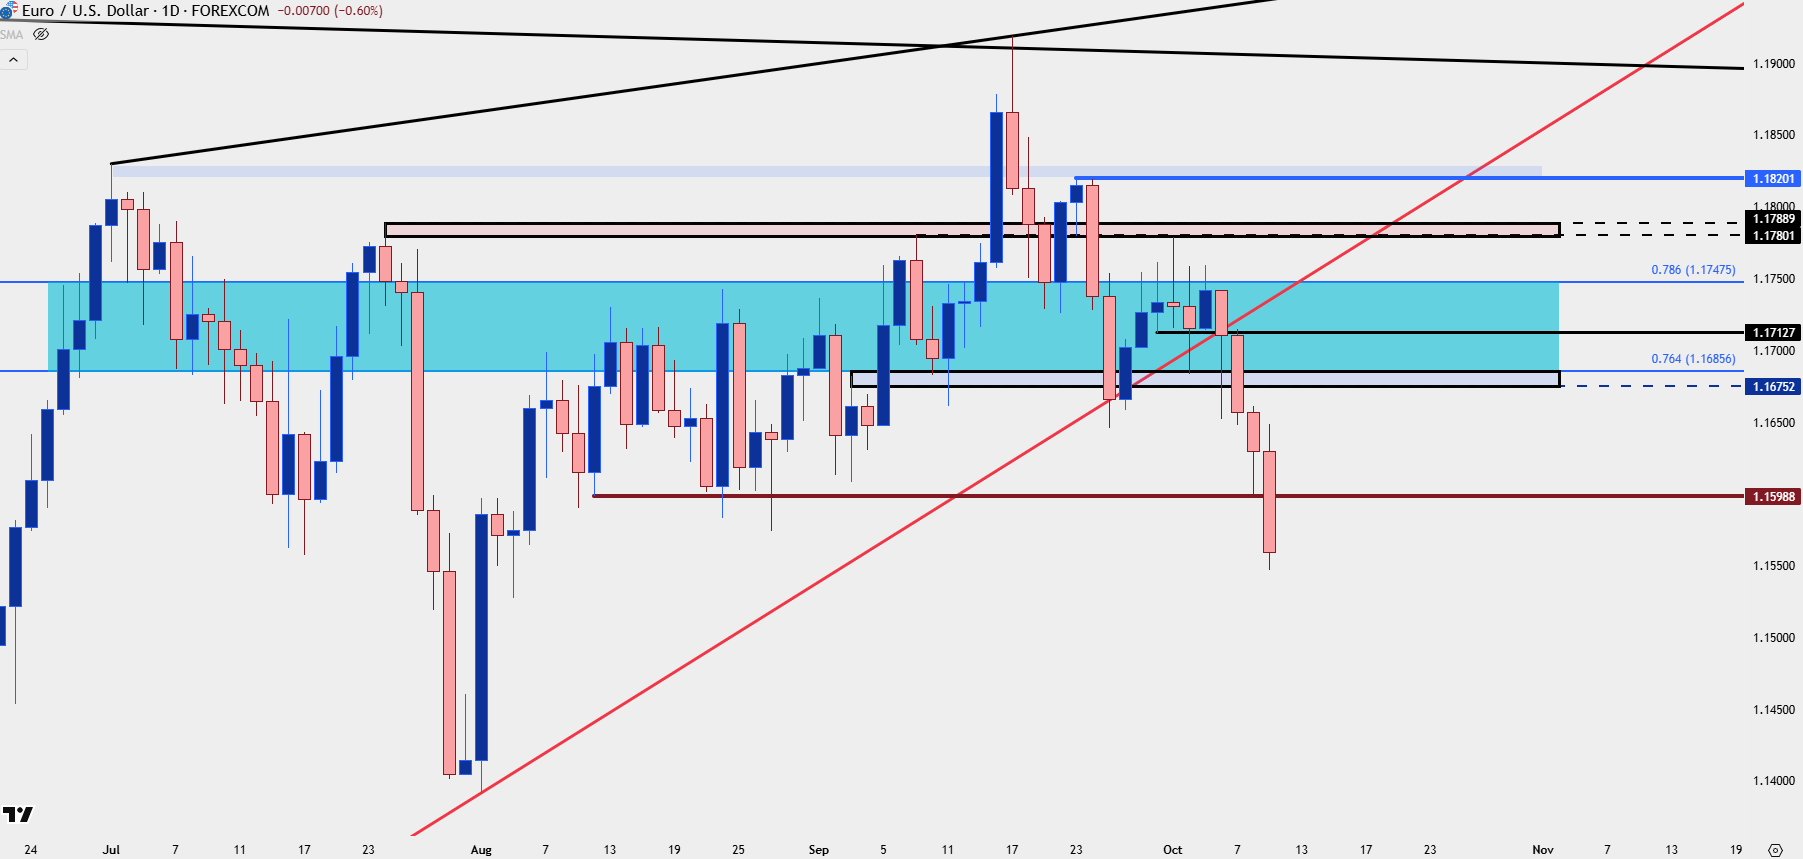
Chart prepared by James Stanley; data derived from Tradingview
EUR/USD Levels
At this point, the recent swing-high at 1.1748 still stands out as significant as that was setting resistance just a week ago. This can also be looked to as a form of invalidation for bearish trends, as you can see from the above chart that level held the highs for all of last week before sellers ultimately prevailed.
This also opens up for quite a few resistance levels in pullback scenarios, with the closest being around the 1.1600 handle that held the lows and led to a minor bounce yesterday.
Above that is a swing of support turned resistance at 1.1646 and then we have the Fibonacci zone from 1.1675-1.1686. There’s one more level above that that I think could be justified for bearish continuation at 1.1713, but if there’s a retracement of that size I would assume that something was shifting in the backdrop. This wouldn’t necessarily preclude bearish continuation but it would bring question as to whether a further test of 1.1748 may soon be in the cards.
EUR/USD Four-Hour Price Chart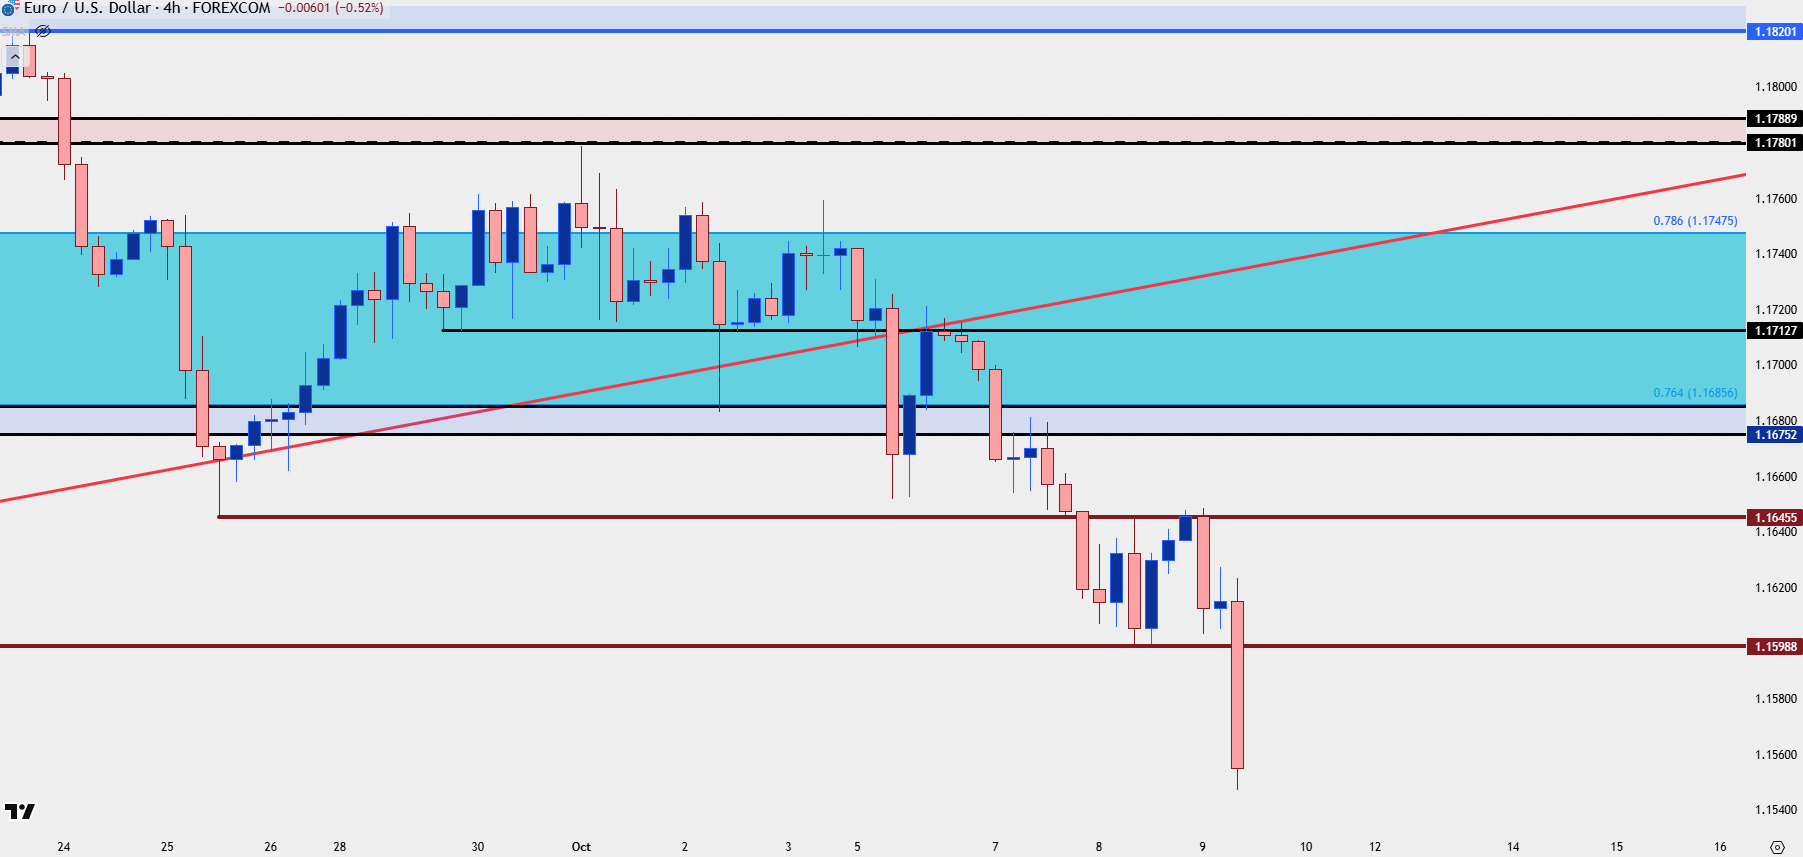
Chart prepared by James Stanley; data derived from Tradingview
--- written by James Stanley, Senior Strategist