


Asian Indices:
- Australia's ASX 200 index fell by -20.7 points (-0.28%) and currently trades at 7,258.30
- Japan's Nikkei 225 index has fallen by -119.52 points (-0.36%) and currently trades at 33,303.00
- Hong Kong's Hang Seng index has fallen by -195.61 points (-1.01%) and currently trades at 19,220.07
- China's A50 Index has fallen by -114.79 points (-0.9%) and currently trades at 12,612.81
UK and Europe:
- UK's FTSE 100 futures are currently down -5.5 points (-0.07%), the cash market is currently estimated to open at 7,514.22
- Euro STOXX 50 futures are currently down -8 points (-0.18%), the cash market is currently estimated to open at 4,382.99
- Germany's DAX futures are currently down -16 points (-0.1%), the cash market is currently estimated to open at 16,023.17
US Futures:
- DJI futures are currently down -31 points (-0.09%)
- S&P 500 futures are currently down -1.5 points (-0.03%)
- Nasdaq 100 futures are currently down -14.25 points (-0.09%)

Sentiment is a little lower thanks to another weak PMI print from China. Services PMI expanded at a slower rate of 53.9 compared with 57.1 previously and 56.2 expected. This could see a slight risk-off tone to the beginning of the session as traders catch up on news. But it also begs the question as to whether this simply more stimulus is coming, which could potentially help to support sentiment (and risk assets such as the DAX).
European indices retraced for a second day during low-liquidity trade, which saw the STOXX 50 pull bac from its 16-year high set on Monday with a small bearish hammer candle. The FTSE 100 printed a Doji but held above 7500 – a key level for bulls to defend today, whilst the DAX pulled further back within Friday’s bullish-breakout day but closed above a key support between 15,988 – 16,000.
DAX daily chart:

The daily chart shows the strong rally on Friday thanks to softer US inflation figures and lower consumer price inflation expectations. Prices have pulled back for two days during thin trade, but we have the 38.2% Fibonacci retracement level, 50-day MA and 16l area to provide potential support. This could either allow aggressive swing traders to try and capture an upswing with relatively tight risk management (on a lower timeframe) or more patient traders could seek entries on the daily chart after the open and seek a higher target.
DAX 1-hour chart:
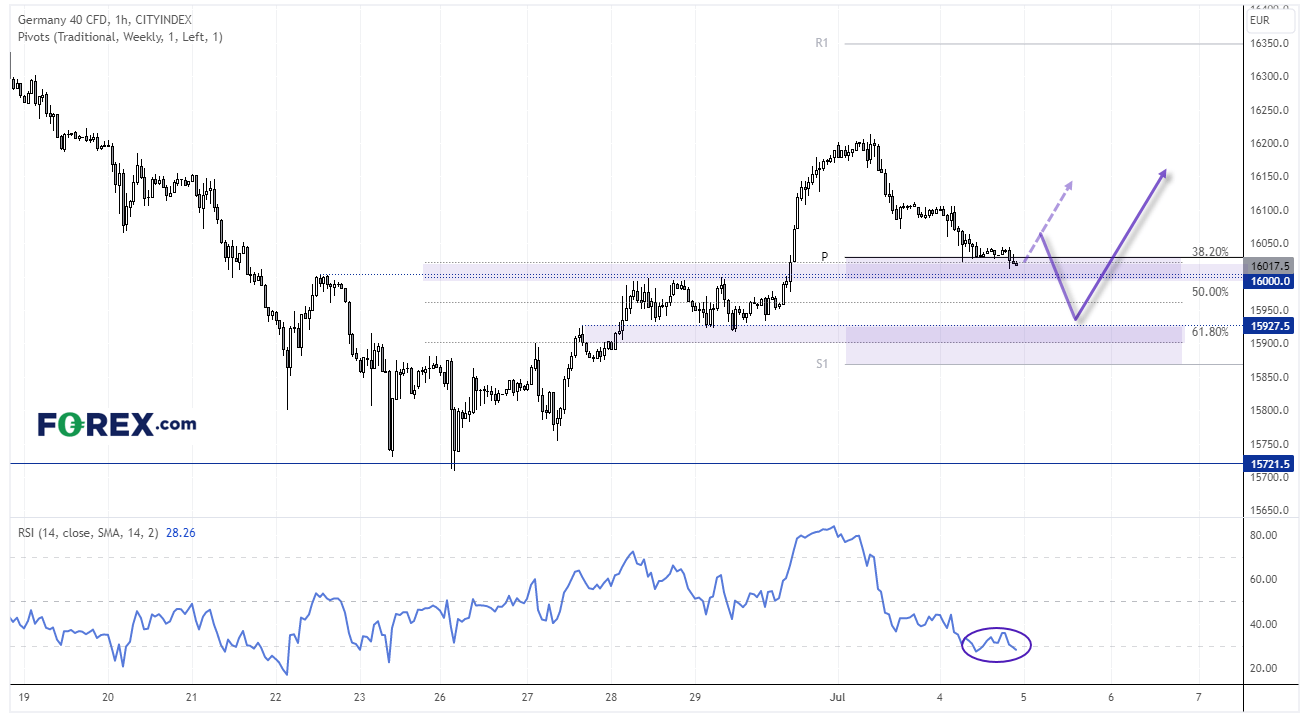
The 1-hour chart is trending lower as part of a retracement on the daily timeframe. 16k is a big level to break so perhaps we’ll see a minor rebound from here, whilst a break beneath it brings previous consolidation between 15,930 – 16,000 into focus. Given the daily structure, we’d then seek evidence of a swing low and for momentum to turn higher. Note that RSI is now in the oversold level, although we’re yet to see a bullish divergence develop to hint at a trend reversal on this timeframe.
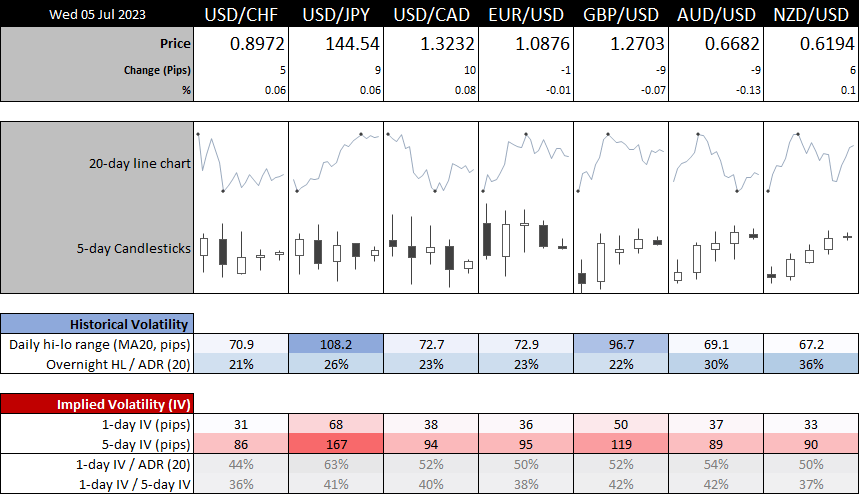
Volatility among forex majors remained low overnight, with most daily ranges sitting ~20% of their 20-day average. The 1-day implied volatility (IV) levels also remain low, and generally coming in around 40-60% of the 20-day average ranges. And with the 1-day IV below the 5-day, is further underscores a feeling of calm as we enter the midway point of the week, but perhaps volatility can be given a bump with the return of US traders returning to their desks.
EUR/USD is probing its lows of yesterday’s bearish inside day, USD/CHF remains in a choppy range on the daily chart and prices on USD/JPY remain range-bound with the daily candles overlapping. Meanwhile, AUD/USD and NZD/USD bulls have benefitted from the RBA’s hawkish pause yesterday and trade in tight ranges near yesterday’s highs. And whilst GBP/USD is pulling back, its trend structure on the daily and 4-hour chart remains bullish so we’ll continue to look for support to build and a potential move back towards 1.2800.
Gold appears to be moving in lockstep with GBP/USD on the intraday charts so, as long as prices remain above the lows around 1919.50 then, we suspect another leg higher could be on the cards. WTI crude oil has formed a lower high on the 30-minite chart beneath yesterday’s high (which itself was a lower high from Monday’s bearish hammer candle). The bias remains bearish beneath 71.50 and for a move towards $70.
View the full economic calendar
-- Written by Matt Simpson
Follow Matt on Twitter @cLeverEdge



