
Key Events
- UK and EU flash manufacturing and services PMIs remain in expansion territory above 50
- Despite these supportive indicators, expectations of a Fed rate hold vs growing rate cut expectations from the BOE and ECB, alongside geopolitical tensions, are keeping the US dollar well supported across FX markets.
Risk-off sentiment, driven by US–Iran tensions and stretched AI sector valuations, is capping gains across risk assets while boosting safe havens, including precious metals and the dollar.
The dollar is up 1% this week, reinforcing bullish breakout risks in the context of prolonged Fed rate hold expectations versus shorter-term rate cut expectations for the BOE, following inflation easing back toward 3%, and potentially for the ECB should oil-driven inflation risks subside.

Crude oil prices are hovering near breakout levels that could threaten the emergence of a longer-term bullish structure. This keeps the ECB in a wait-and-see mode before cutting rates, even though inflation is currently below target at 1.7%.
This policy divergence continues to keep key technical patterns and levels in focus to assess the sustainability of current moves.
DXY Outlook: Monthly Time Frame – Log Scale

Source: Trading view
Technically, the pattern I have been monitoring for some time remains intact, preserving the DXY’s bullish bias above the 18-year trendline and the 95 zone.
A sustained move above 99.50 could amplify upside momentum.
Only a decisive close below this long-term trendline would confirm a broader downturn for the greenback, a scenario that could finally allow sustained gains across EURUSD and GBPUSD.
EURUSD Outlook: Two Week Time Frame – Log Scale
Source: Trading view
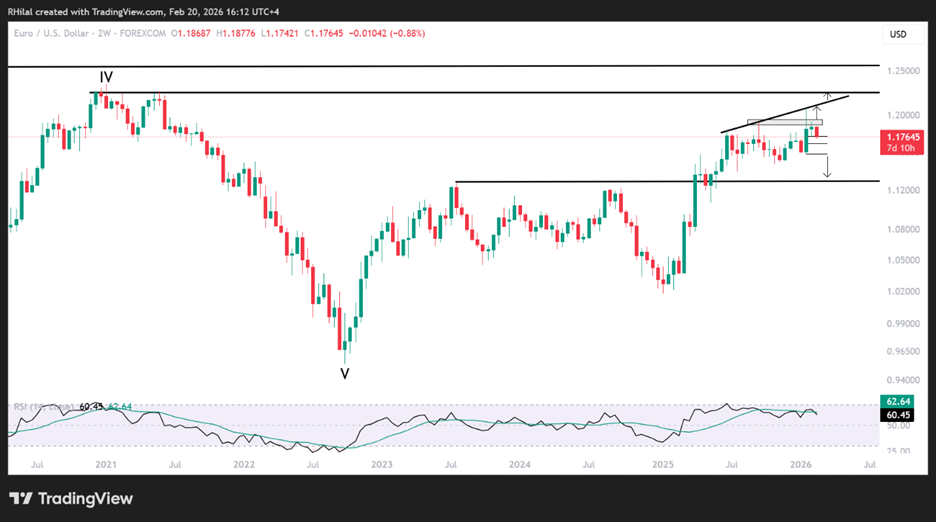
On the two week chart, EURUSD is facing resistance connecting consecutive higher highs since June 2025, capping gains below the key 1.1950 zone. A daily or weekly close above this level is required to reassert bullish bias toward 1.20, before potentially extending toward the 2022 and 2018 highs near 1.23 and 1.25 respectively.
That outlines the bullish scenario. However, recent price action is turning lower, with downside risks building. A break below 1.1760, which represents the 0.618 retracement of the 2026 advance, could open the door to deeper drawdowns toward:
• 1.1680
• 1.1580
The 1.1580 level becomes pivotal. A hold there could revive bullish momentum. Failure to stabilize may expose the 1.12–1.11 zone, a scenario in which renewed dollar strength takes control.
GBPUSD Outlook: Monthly Time Frame – Log Scale
Source: Trading view
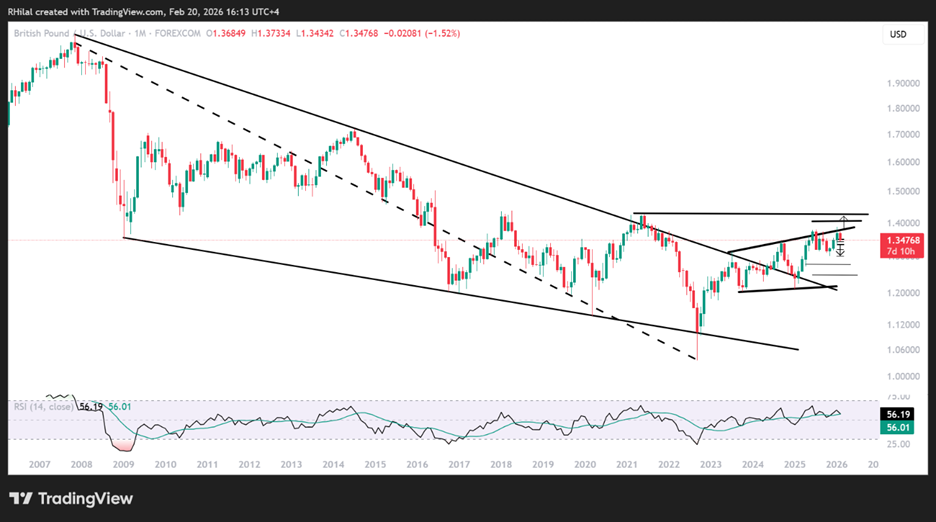
From a monthly perspective, price action is challenging a resistance zone connecting higher highs since June 2023, keeping consolidation risks in play as price action navigates the breakout from the 2007-2024 descending consolidation.
A sustained break below 1.3430 exposes 1.3330, a level that aligns with the 0.618 Fibonacci retracement of the November–January advance. A deeper break below 1.33 would increase the probability of a move toward the 1.30 psychological zone, a scenario that would likely coincide with broader DXY strength.
On the upside, a daily or weekly close back above 1.3730 would reassert bullish momentum, exposing 1.3830 and the 1.40 threshold, continuing the broader breakout beyond the 2007–2024 consolidation range illustrated below.
Written by Razan Hilal, CMT
Follow on X: @Rh_waves