


Weekly Technical Trade Levels on USD Majors, Commodities & Stocks
- Technical trade setups we are tracking into the start of the week on the USD Majors, commodities, and equity indices.
- Next Weekly Strategy Webinar: Monday, September 21 at 8:30am ET
- Event risk this week: UK employment & CPI and the BoE, FOMC & BoJ rate decisions
- Review the latest Video Updates or Stream Live on my YouTube playlist
In this webinar we take an in-depth look at the technical trade levels for the US Dollar (DXY), Euro (EUR/USD), British Pound (GBP/USD), Australian Dollar (AUD/USD), Canadian Dollar (USD/CAD), Japanese Yen (USD/JPY), Swiss Franc (USD/CHF), Gold (XAU/USD), Crude Oil (WTI), Bitcoin (BTC/USD), S&P 500 (SPX500), Nasdaq (NDX), and Dow Jones (DJI). These are the levels that matter on the technical charts into the weekly open. The assets are chaptered on the recording for your convenience.
British Pound Price Chart – GBP/USD 240min
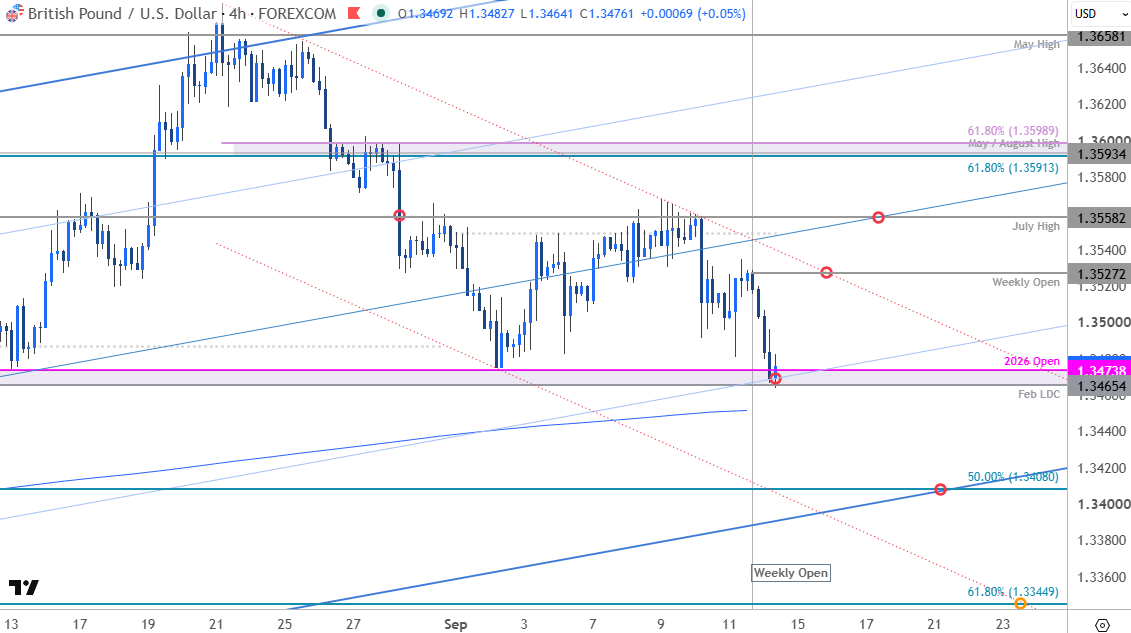
Chart Prepared by Michael Boutros, Sr. Technical Strategist; GBP/USD on TradingView
Notes: Sterling is testing confluent support into the start of the week at the yearly open and the February low-day close (LDC) at 1.3465/74. Note that the 25% parallel of the July pitchfork converges on this region over the next few days and the focus is on possible inflection off this zone. A break / daily close below the 200-day moving average (currently ~1.3452) would threaten a test of broader uptrend support which converges on the 50% retracement of the June advance at 1.3408.
Weekly open resistance converges on the August channel line near 1.3527 with a breach / close above the July high at 1.3558 needed to suggest a more significant near-term low is in place and mark resumption of the uptrend. The next major technical hurdle is eyed near 1.36 where a cluster of Fibonacci levels converges on the 2025 May & August highs.
Bottom line: GBP/USD is testing support at the monthly opening range lows with major event risk on tap this week. From a trading standpoint, rallies should be limited to 1.3527 IF price is heading for a break lower on this stretch with a close below the 200DMA needed to fuel the next leg of the decline.
GBP/USD faces a heavy slate of event risk this week, beginning with UK employment data followed by the latest CPI inflation report. Both releases could prove critical in shaping expectations for the Bank of England ahead of its rate decision, particularly as policymakers weigh persistent price pressures against the health of the labor market. Attention then shifts to the Fed and BoE policy decisions, where the relative tone and guidance from both central banks could drive a meaningful repricing in rate expectations. With policy differentials firmly in focus, Sterling volatility could remain elevated into the weekly close.

Swiss Franc Price Chart – USD/CHF 240min
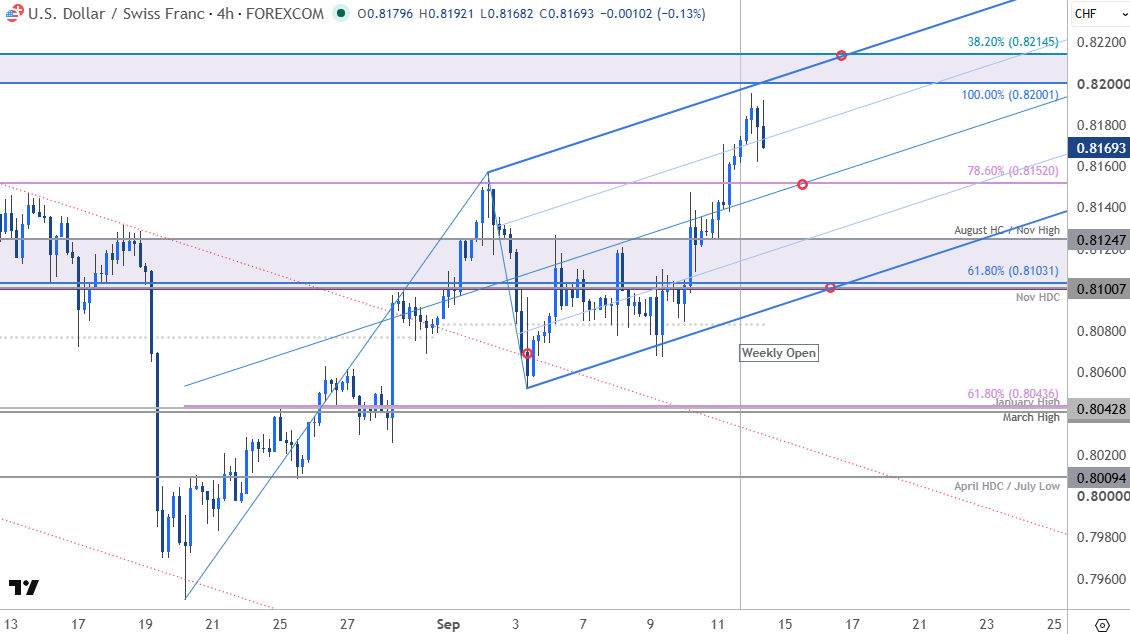
Chart Prepared by Michael Boutros, Sr. Technical Strategist; USD/CHF on TradingView
Technical Outlook: USD/CHF broke above the September opening range highs on Friday with the rally exhausting today just ahead of critical resistance at 8200/15. This region is defined by the 100% extension of the January advance, the yearly high, and the 38.2% retracement of the 2025 decline. The upper parallel of the monthly pitchfork converges on this zone over the next few days and a breach / daily close above is needed to fuel the next major leg of the advance. The next major technical consideration is eyed at the 2023 swing low near 8333.
Initial support rests at the 78.6% retracement of the July decline at 8152 and is backed closely by the 2025 August high-close (HC) and the November high at 8125. Bullish invalidation is now raised to the November high-day close (HDC) at the 81-handle. Losses below this threshold would invalidate the August uptrend and suggest a larger correction is underway.
Bottom line: USD/CHF is trading just below pivotal resistance, and the long bias may be vulnerable below this level. From a trading standpoint, losses should be limited to 8125 IF price is heading higher on this stretch with a close above 8215 needed to fuel the next major leg of the rally. Event risk is limited out of Switzerland this week so watch USD price action for guidance here.
Bitcoin Price Chart – BTC/USD Daily
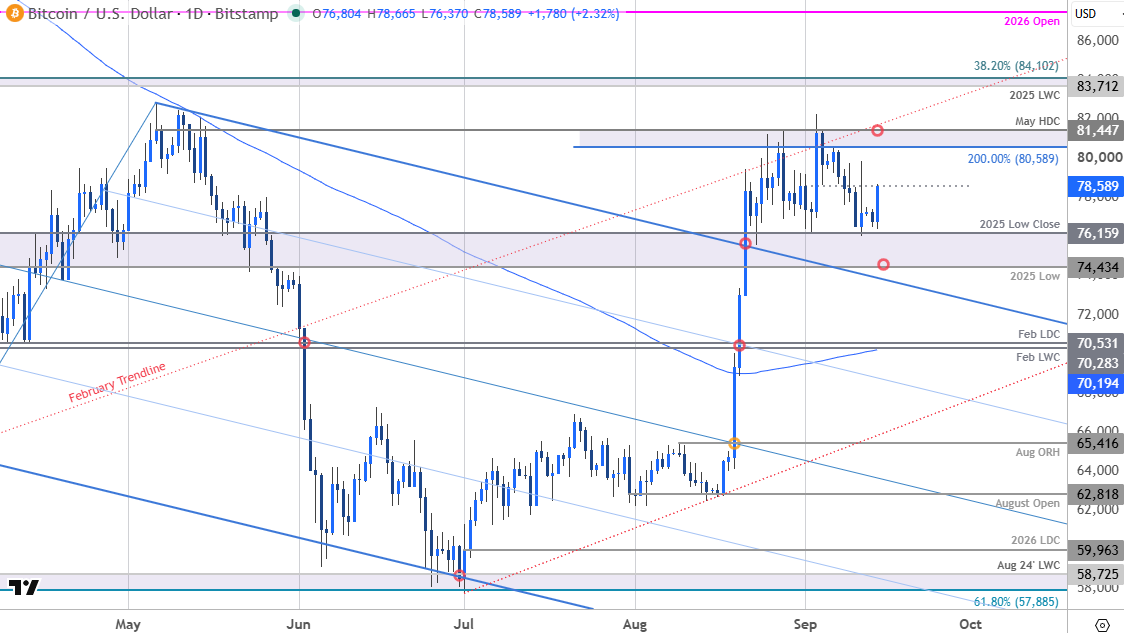
Chart Prepared by Michael Boutros, Sr. Technical Strategist; BTC/USD on TradingView
Notes: Bitcoin is trading within the confines of a well-defined monthly opening range just below resistance at the Mary high-day close (HDC) and the 200% extension of the July advance at 80,589-81,447. The focus is on a breakout of this range in the days ahead to clear the way for the next directional move.
Initial support rests with the 2025 low close at 76,159 with medium-term bullish invalidation steady at the 2025 low at 74,434. Monthly open resistance is being tested today at 78571 with key breakout of the monthly range high needed to fuel the next leg of the advance. Key resistance is eyed at the 2025 low-week close and the 38.2% retracement of the decline off the record highs at 83,712-84,102. A breach / weekly close above this threshold is needed to suggest the low of the year may be in place, and a larger trend reversal is underway.
Bottom line: The focus is on a breakout of the monthly range for guidance here. From a trading standpoint, losses would need to be limited to 74,434 IF Bitcoin is heading higher on this stretch with a close above 81,447 needed to mark resumption of the July advance.
Economic Calendar – Key Data Releases
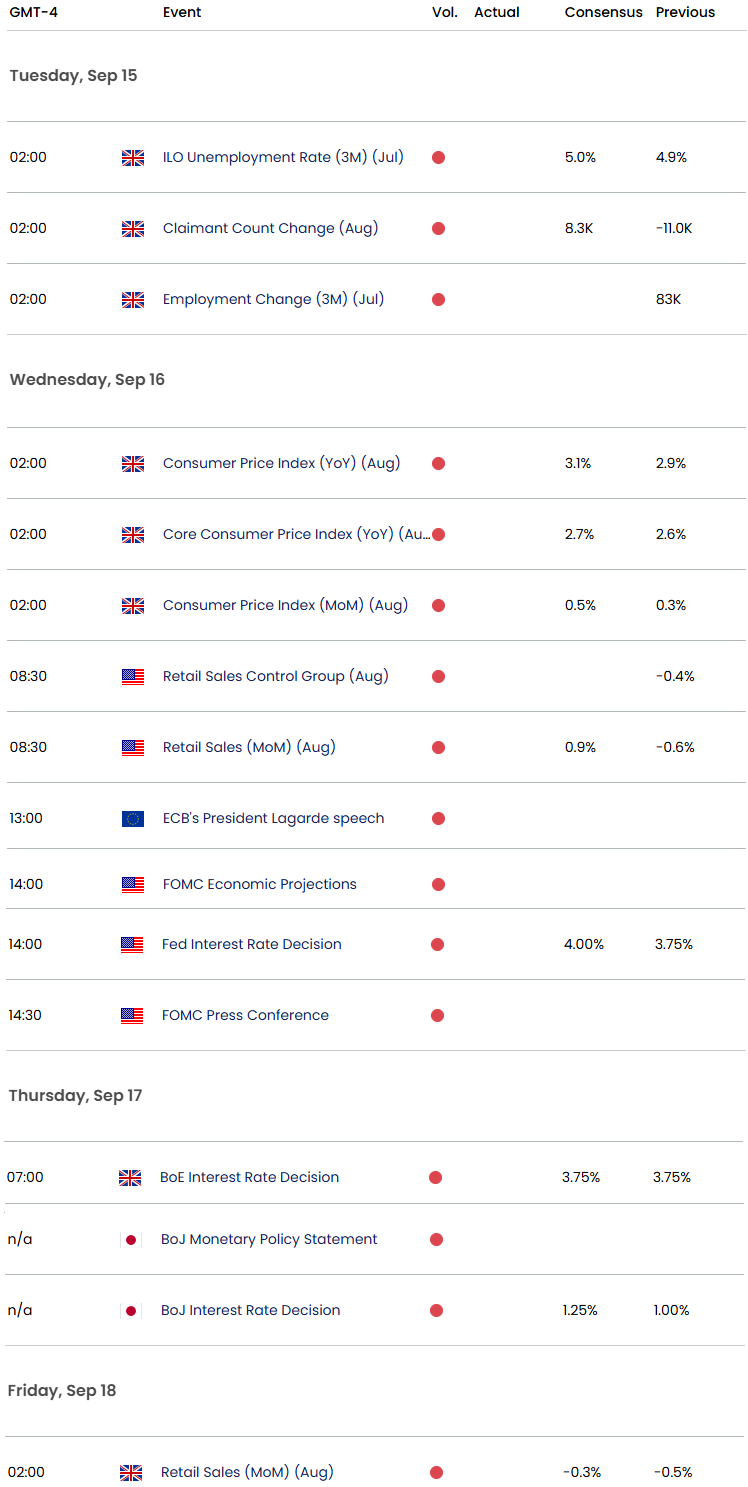
Economic Calendar - latest economic developments and upcoming event risk.
--- Written by Michael Boutros, Senior Technical Strategist
Follow Michael on X @MBForex




