In 2025, GBP/USD rose from 1.21, a 15-month low, to a four-year high of 1.3790 by July 1, before consolidating across the summer. The pair fell between September and November before bouncing back in the final weeks of the year. However, with questions over how much lower the USD could go, GBP/USD may struggle to book another strong year in 2026. For more insight into the fundamental factors set to drive GBP/USD in 2026, see the fundamental outlook.
GBP/USD technical analysis
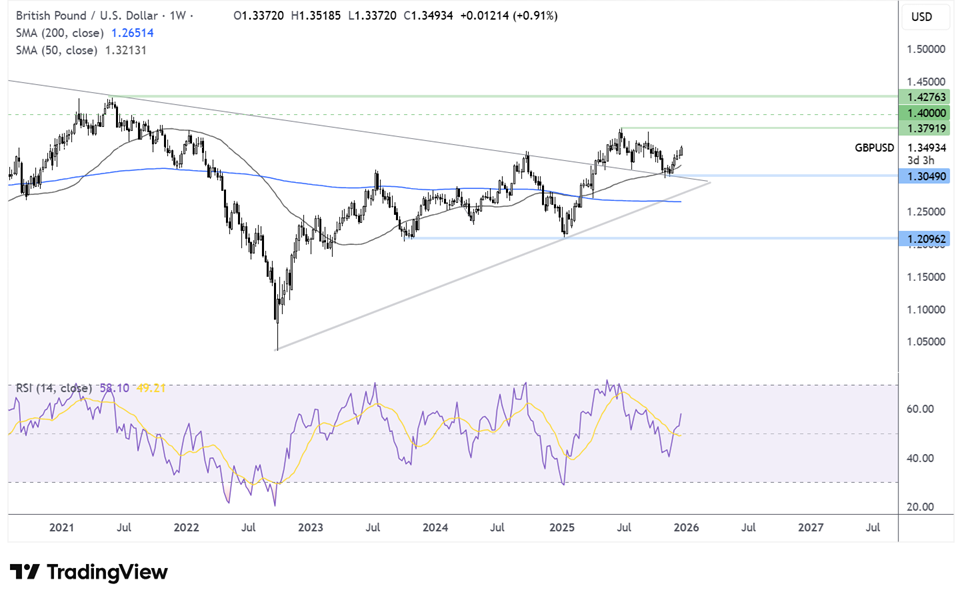
GBP/USD broke out of the symmetrical triangle pattern, rising to a multi-year high of 1.3790, before easing back and testing the trendline support at 1.30 and recovering higher.
The price trades above the 50- and 200-day SMA, which, together with the RSI above 50, suggests a continuation of the recovery towards 1.3790.
A rise above 1.3790 creates a higher high, bringing 1.40 the psychological level and 1.4250, the 2021 high, into focus.
Sellers would need to break below 1.30 to create a lower low and bring 1.2780, the rising trendline support, into focus. A break below here exposes the 200 SMA at 1.2650 ahead of the 1.21 January low.