


Despite the recent recovery in XAU/USD, which has posted gains of more than 1.4%, the average performance over the last five sessions still reflects meaningful downside pressure, with a cumulative decline of around -2.1% in the short term.
This suggests that, beyond the recent rebound, the market has not been able to establish a clear direction, and a phase of indecision has begun to dominate price action.
This dynamic follows a week of central bank decisions, which have had a direct impact on the bond market, limiting the ability of gold to sustain upward momentum in the short term. In this context, neutrality may persist until a clearer shift in demand strength emerges.

Central bank week
This week has featured key monetary policy events, including decisions from the Bank of Japan, the European Central Bank, the Bank of Canada, and the Federal Reserve. However, the main takeaway has been the general trend toward interest rate stability.
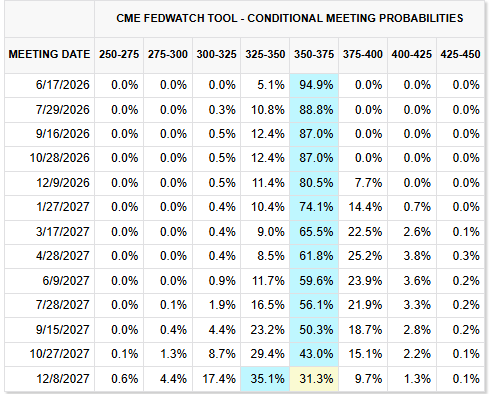
In the case of the Federal Reserve, rates were held at the 3.75% level, and comments reinforced the idea that this stance could continue in future decisions, supporting a higher-for-longer rate environment.
This is reflected in CME Group probabilities, where the next scheduled decision in June shows a roughly 94.9% probability of no change. Moreover, there is over 80% probability that this dynamic could extend through the end of 2026, limiting expectations for rate cuts in the short term.
Source: CMEGROUP
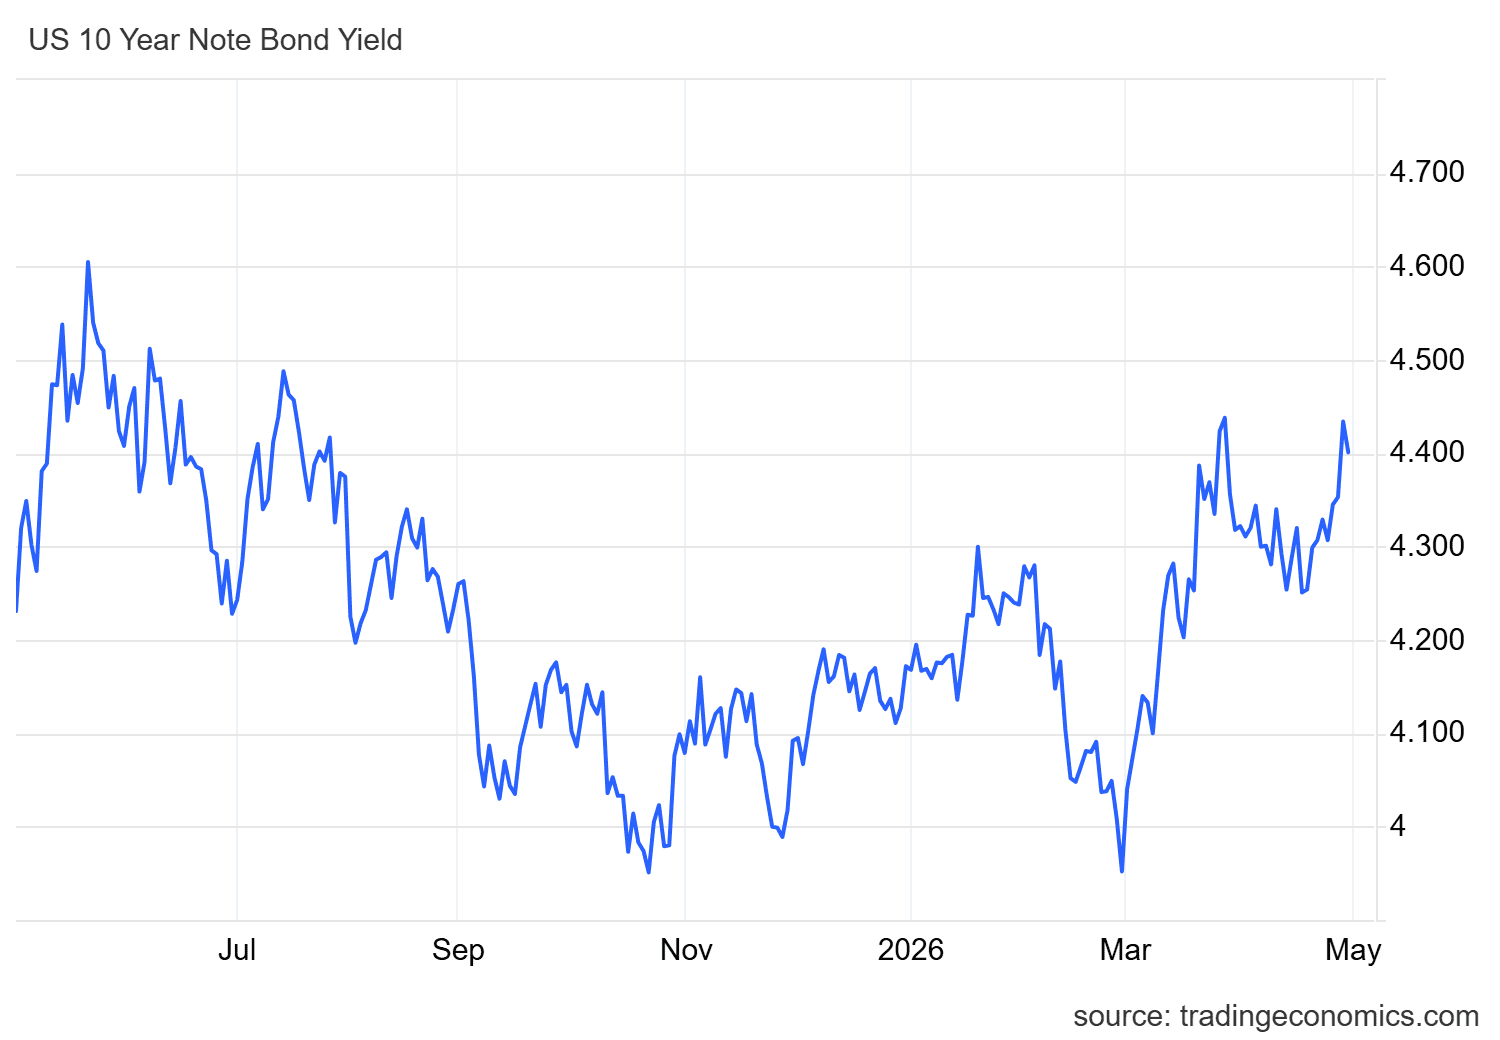
This environment has already begun to impact the bond market, which is considered a substitute for gold. In the United States, 10-year Treasury yields have shown a consistent upward trend, moving above the 4.4% level, similar to levels seen at the end of March.
Although a slight pullback has been observed recently, the overall structure still reflects an environment of elevated and stable rates, which continues to limit gold’s upside potential in the short term.
Source: TradingEconomics
With this in mind, it is important to note that a high-rate environment in the bond market is typically negative for gold, as both assets compete as safe havens. As bond yields rise, their relative attractiveness increases, diverting capital flows away from gold.
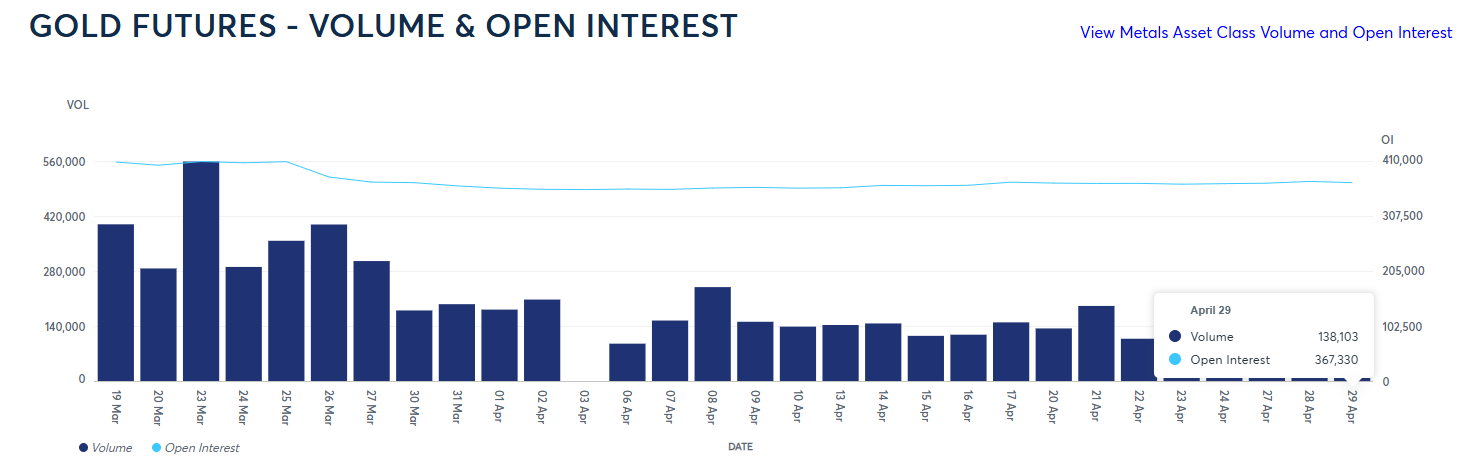
This dynamic is already visible in market activity. In the gold futures market, trading volume as of April 29 stood at around 138,000 contracts, a figure that remains in line with recent weeks but significantly below the more than 400,000 contracts seen in March.
This suggests that, despite the recent price rebound, demand remains weak, reinforcing the idea that the current move lacks strong underlying support.
Source: CMEGROUP
Taking all of this into account, the bond market’s rate dynamics remain a key factor limiting gold’s recovery. If yields continue to hold at elevated levels or resume their upward trend, they could further restrict capital flows into gold.
In this context, XAU/USD is likely to remain in a phase of indecision unless there is a meaningful shift in liquidity conditions or in the behavior of alternative markets in the coming sessions.
Technical outlook for Gold

Source: StoneX, Tradingview
- Bearish trendline remains dominant: Despite recent recovery attempts, the daily chart continues to show a well-defined bearish trendline that has been in place since early March. So far, price action has not been strong enough to invalidate this structure, meaning it remains the most relevant technical pattern. If selling pressure consolidates again, this trend could continue to dominate in the coming sessions.
- RSI: The RSI remains close to the 50 level, reflecting a balance between buying and selling forces. This supports the view that indecision remains a key driver in the short term.
- MACD: The MACD shows a similar pattern, with the histogram hovering near the zero line, indicating a balance in moving average strength. This reinforces the view of a market lacking clear direction.
Key levels to watch:
- 4,842 USD – Key resistance: A level of recent highs aligned with the 50-period moving average. A break above this level could invalidate the bearish structure and support a more dominant bullish bias in the coming weeks.
- 4,613 USD – Near-term barrier: A neutral zone that has acted as a retracement level in recent weeks and aligns with the 38.2% Fibonacci level. Price action around this level could reinforce a sideways phase in the short term.
- 4,378 USD – Key support: A level of recent lows acting as the main downside barrier. A move toward this zone could reactivate selling pressure and support the continuation of the bearish trend in the coming sessions.
Written by Julian Pineda, CFA, CMT – Market Analyst
Follow him on: @julianpineda25




