
Over the past four trading sessions, gold price action has posted gains of more than 4%, marking new all-time highs and sustaining a consistent bullish bias toward the close of 2025. For now, buying pressure has remained firm, driven by the declining appeal of substitute assets such as U.S. Treasuries, as well as the lack of a full recovery in overall market confidence. This environment has allowed gold to maintain steady demand during recent sessions. As long as these conditions persist into year-end, buying pressure is likely to continue dominating the metal’s short-term price movements.

Bonds Lose Ground
As year-end approaches, Federal Reserve dynamics continue to evolve with an eye toward 2026. Currently, the market assigns a probability of approximately 82.3% that the central bank will maintain a neutral stance at its rate decision scheduled for January 28, 2026. However, probability distributions are beginning to show notable shifts ahead of the March 18 meeting, where there is a 46.7% probability of rates remaining unchanged and a rising 45.6% probability of a 25-basis-point rate cut, which would bring the policy rate to a potential level of 3.50%. These figures reflect persistent indecision in market expectations regarding the future direction of Federal Reserve monetary policy in 2026.

Source: CMEGROUP
This uncertainty surrounding U.S. monetary policy appears to be creating an environment of lower yields in the U.S. Treasury market. In recent sessions, yields have retreated from levels near 4.2% and are now oscillating around 4.1%, reinforcing a short-term outlook of softer rates. This behavior reduces the relative attractiveness of U.S. fixed-income assets.
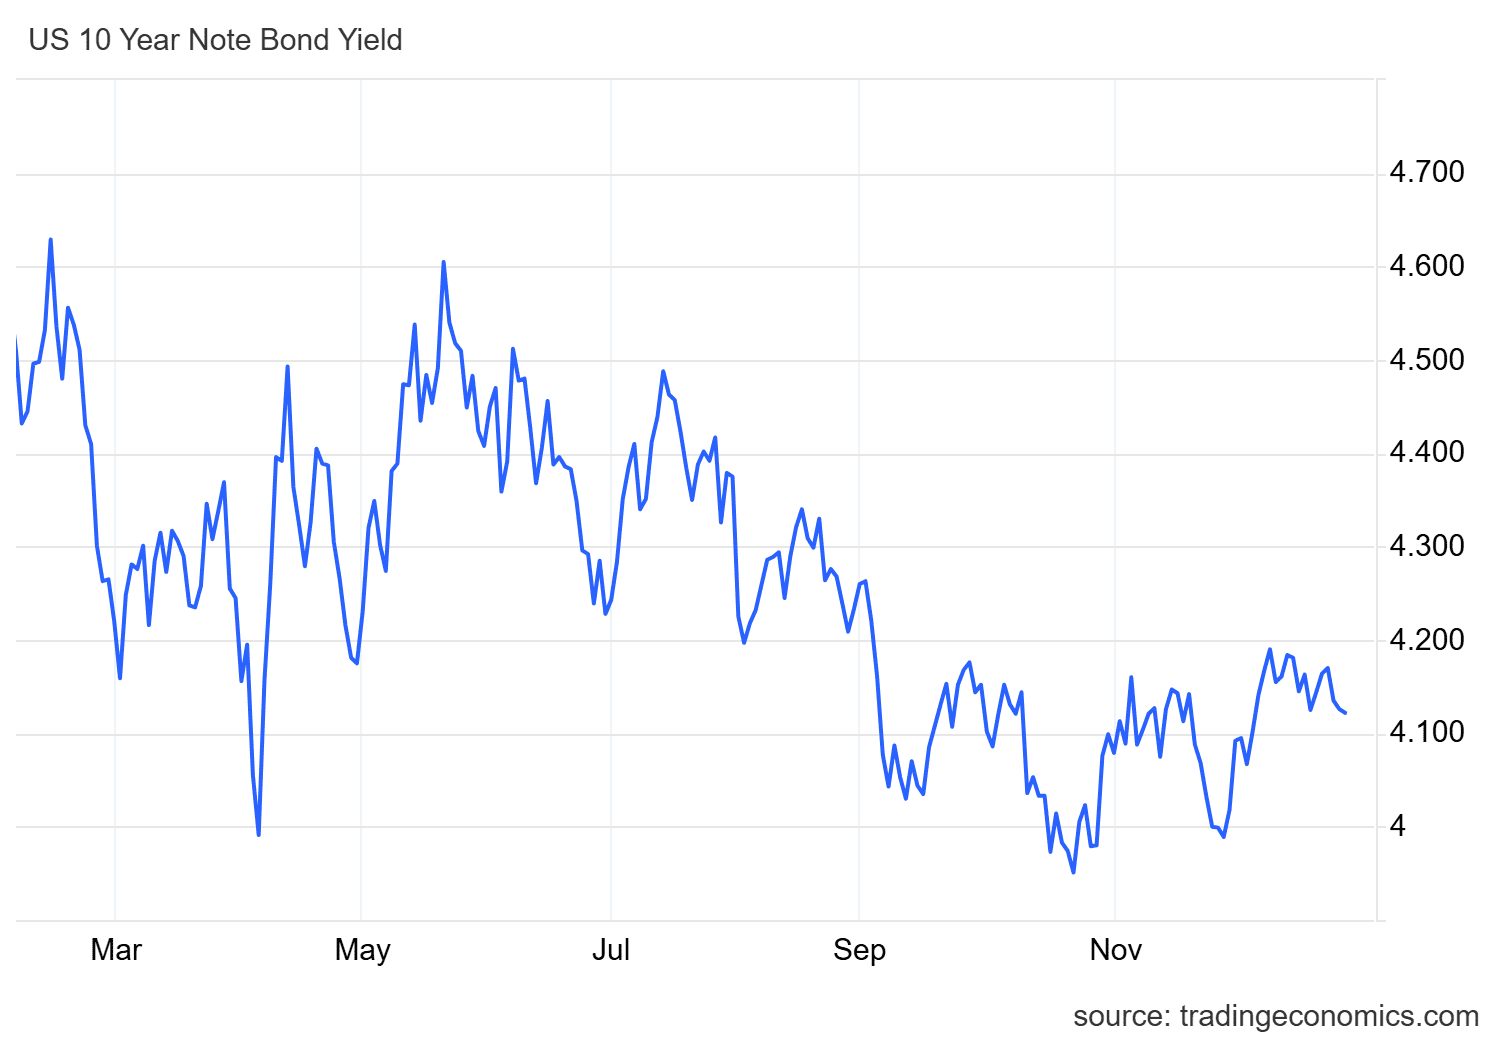
Source: TradingEconomics
With this in mind, it is important to remember that Treasury bonds act as one of gold’s main substitute assets. As yields continue to decline, the bond market becomes less attractive, potentially driving a reallocation of capital toward gold as a safe-haven asset. This backdrop supports sustained demand for the precious metal and positions gold as a relatively more attractive asset in the short term. As long as Federal Reserve-related indecision continues to weigh on yields, this factor may remain a key fundamental catalyst supporting continued buying pressure in XAU/USD over the coming sessions.
Does Confidence Continue to Play a Role?
Despite gold reaching new all-time highs in recent months, it continues to be perceived as one of the market’s most relevant safe-haven assets. As a result, part of its demand remains closely tied to the evolution of market confidence indicators.
In recent weeks, CNN’s Fear & Greed Index has shown a notable recovery, rising from the “fear” zone into the “greed” zone, with current readings near 58 points. However, as the year draws to a close, a flattening in the confidence curve has begun to emerge, which could translate into a phase of short-term indecision.
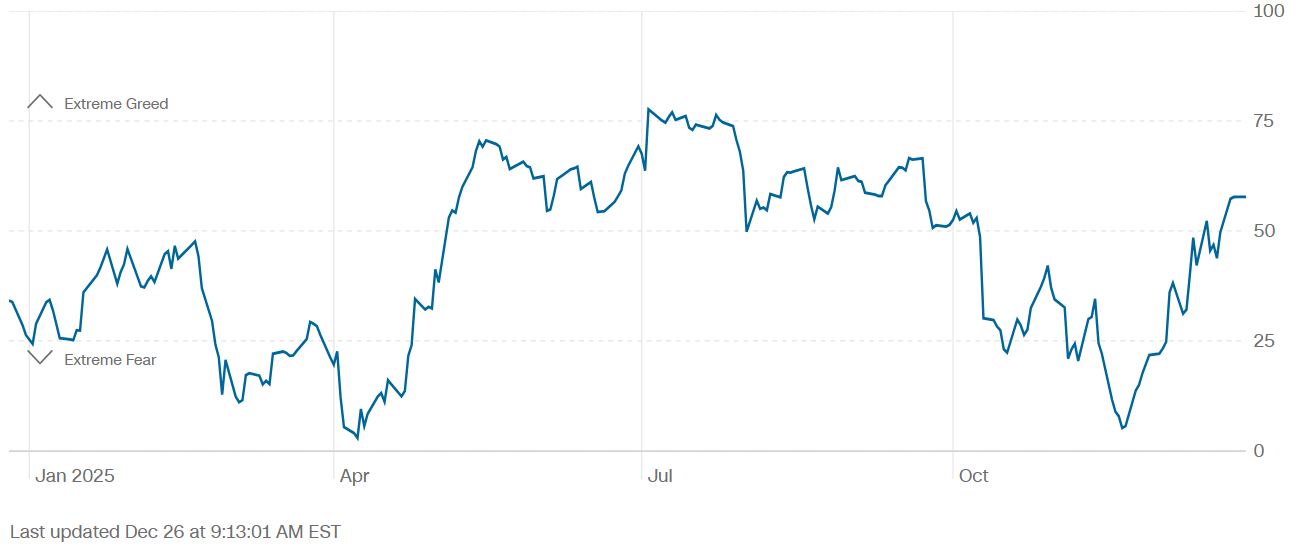
Source: CNN
As long as the index fails to consolidate more decisively above the “greed” zone, this behavior may signal a neutral confidence environment, which in turn could help sustain demand for safe-haven assets such as gold. If the Fear & Greed Index does not maintain consistent upward momentum, demand for the precious metal is likely to remain present in the coming trading sessions.
Gold Technical Outlook

Source: StoneX, Tradingview
- Dominant bullish trend: For more than three months, gold has maintained a bullish trendline that has dominated price action and enabled the formation of new all-time highs above $4,500 per ounce. So far, no significant bearish moves have emerged that would structurally threaten this trend, leaving it as the most important technical reference in the short term. However, as price continues to advance and set new highs, a gradual exhaustion phase may begin to develop, potentially opening the door to corrective pullbacks in the sessions ahead.
- RSI: The RSI remains above the neutral 50 level, indicating that average buying momentum over the past 14 sessions continues to dominate. That said, the indicator has also begun to trade above the 70 level, which marks the overbought zone and may be signaling a potential excess in buying pressure, increasing the risk of short-term corrections.
- MACD: The MACD continues to show a positive histogram above the neutral zero line, confirming that buying momentum remains dominant in short-term moving averages. As long as the histogram continues to expand, buying pressure is likely to remain the prevailing force in XAU/USD price action over the medium term.
Key Levels to Watch:
- $4,600 – Crucial resistance: In the absence of prior technical references, this level stands out as the most relevant psychological barrier. A sustained breakout above this area could pave the way for an even more aggressive bullish trend toward the close of 2025.
- $4,300 – Nearby barrier: A key neutrality zone aligned with former all-time highs, which could act as an important reference in the event of short-term bearish corrections.
- $4,200 – Critical support: A level near the 50-period simple moving average, currently the most important downside barrier to monitor. Selling pressure that pushes price toward this zone could put the current bullish trendline at risk and open the door to a fresh bearish bias toward the end of 2025.
Written by Julian Pineda, CFA, CMT – Market Analyst
Follow him on: @julianpineda25