Over the past four trading sessions, gold (XAU/USD) has shown a variation of just over 1.00%, reflecting a decline in average daily volatility and resulting in a steady neutral bias in the short term. For now, the sense of indecision has become more evident as market expectations shift regarding the Federal Reserve’s monetary policy following the recent release of U.S. employment data.
At the same time, demand for gold from central banks remains solid. This combination of monetary policy uncertainty and consistent central bank demand appears to be driving this prolonged neutrality in gold prices. If this dynamic continues, indecision in gold’s price movements is likely to persist in the near term.

What’s Next for Gold After the NFP Release?
Today, the U.S. Non-Farm Payrolls (NFP) report was released. The market expected 53,000 new jobs, compared with -4,000 in August, but the September data surprised to the upside, with 119,000 new jobs created. This marks a solid recovery in the labor market, which had shown a downward trend until August.

Source: Forexfactory
This outcome partially clarifies the outlook for the Federal Reserve, as stronger labor data reduces the likelihood of near-term rate cuts. A robust labor market does not justify lower interest rates while inflation remains a persistent issue.
According to CME Group, the probability that the Fed will keep its benchmark rate at 4.00% for its December 10 meeting stands at 58.4%, while the chance of a rate cut to 3.75% has fallen to 41.6%. This represents a shift toward a more restrictive monetary stance than the market had anticipated just a few weeks ago.
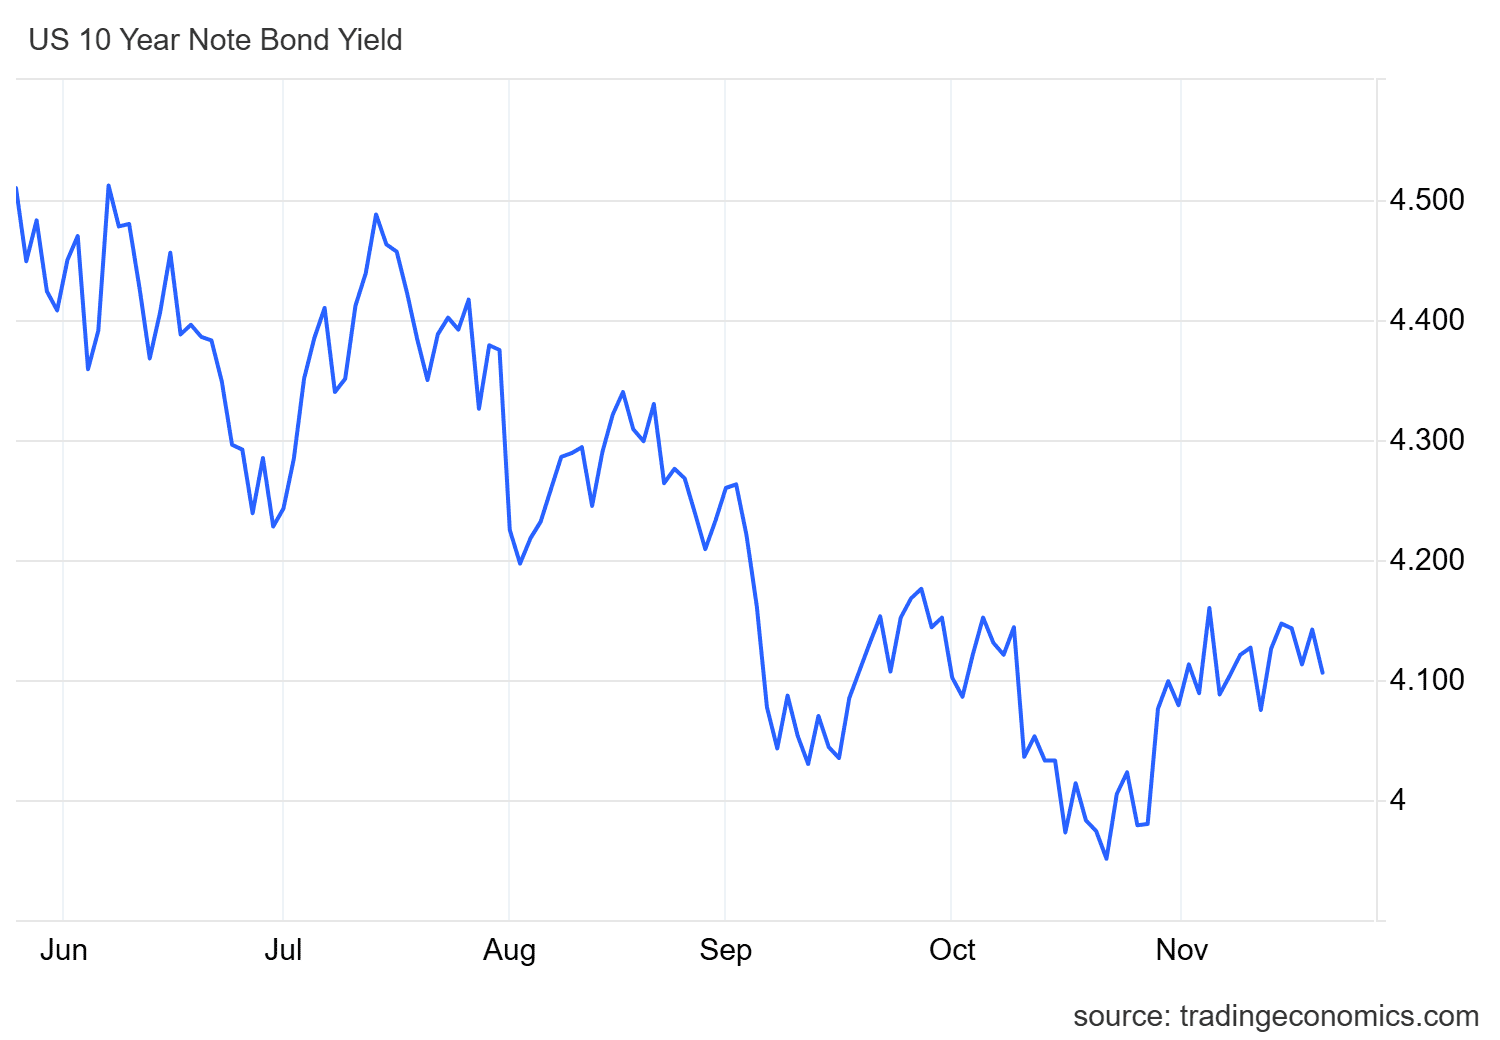
This change in the Fed’s position has kept U.S. Treasury yields elevated, with returns above 4.00%. Since Treasuries are considered a safe-haven asset and a natural substitute for gold, higher yields increase their relative attractiveness, reducing demand for the metal, which does not offer interest or yield to maturity.
Source: TradingEconomics
Consequently, a more hawkish Fed stance following the employment data could sustain strong bond yields and limit gold’s appeal in the short term, potentially leading to continued selling pressure in the XAU/USD in the coming sessions.
Central Bank Purchases
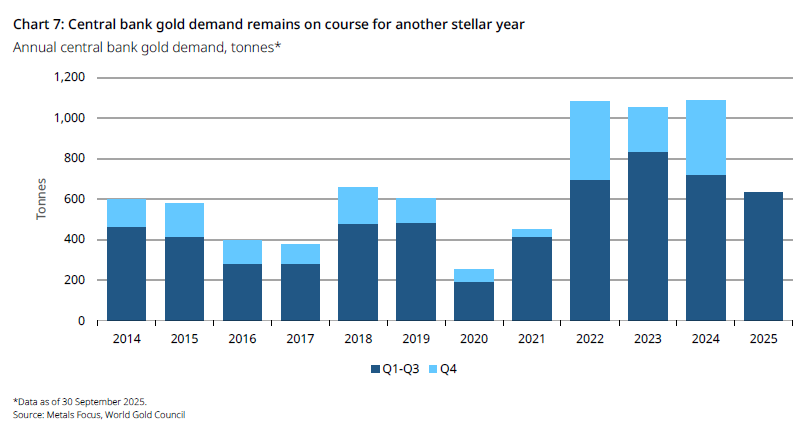
While the bond market has absorbed some of gold’s short-term appeal, the long-term outlook tells a different story. According to the latest data from the World Gold Council, central banks worldwide purchased 220 tons of gold during the third quarter of 2025, a 28% increase compared to the previous quarter. This pattern of steady gold accumulation has persisted since 2022, reflecting a sustained trend of reserve growth by central banks.
Source: WorldGoldCouncil
This suggests that, although gold faces temporary bearish pressure, consistent institutional buying could help sustain long-term confidence in the metal. If this trend continues through the end of 2025, it could become a key catalyst for gold’s stability in 2026, potentially reviving stronger buying pressure over the coming months.
Gold Technical Outlook

Source: StoneX, Tradingview
- Uptrend Trying to Hold: For more than three months, gold has maintained a consistent uptrend, which has so far remained intact despite recent downward corrections. However, if the current neutral phase persists, a short-term consolidation range could form, putting the dominant bullish trend at risk in the coming sessions.
- RSI: The RSI line remains near the neutral 50 level, suggesting a balance between buying and selling forces. As long as this pattern persists, neutral price action is likely to remain dominant in the short term.
- MACD: The MACD shows a similar pattern, with its histogram oscillating near the zero line, reinforcing the idea of technical neutrality in short-term moving averages.
Key Levels to Watch:
- $4,382 – Major Resistance: Corresponds to all-time highs, representing the most significant bullish barrier. A sustained move above this zone could open the door to new record highs, reactivating the buying momentum that has recently weakened.
- $4,124 – Nearby Resistance: Immediate resistance level, corresponding to the 23.6% Fibonacci retracement. As long as prices hover near this zone, indecision may continue to dominate in the short term.
- $4,000 – Critical Support: Considered the most important psychological level, this support aligns with the 38.2% Fibonacci retracement and the 50-period simple moving average. A break below this level could endanger the current uptrend, paving the way for a more consistent bearish bias in the short term.
Written by Julian Pineda, CFA, CMT – Market Analyst
Follow him on: @julianpineda25