


The week continues to unfold, and for now, gold price action has not shown any meaningful changes in the short term. The average variation over the last two sessions reflects a consistent neutral phase, with moves of around 1.5%, which, rather than indicating a clear direction, highlights a dynamic of indecision in price behavior.
One of the factors limiting gold’s recovery appears to be the performance of the bond market, which, as a substitute asset, has started to reduce the metal’s appeal. As long as this dynamic remains in place, the current phase of indecision is likely to continue in the coming trading sessions.

The bond market remains a key threat
Several sessions have now passed since the central bank decision week, where the general trend was to keep interest rates unchanged and reinforce a stable policy stance in the short term. In particular, the Federal Reserve has made it clear that it maintains a stance between neutral and restrictive, with higher rates for longer.
The CME Group probability outlook shows that there is more than an 80% chance that rates will remain at current levels through October of this year. However, more importantly, probabilities above 30% have begun to emerge suggesting that even in 2027 there could be another rate hike toward the 4.00% level by the US central bank.
This reflects a scenario where not only are rate cuts ruled out in the short term, but the possibility of further hikes remains on the table, reinforcing the idea of a prolonged high-rate environment.
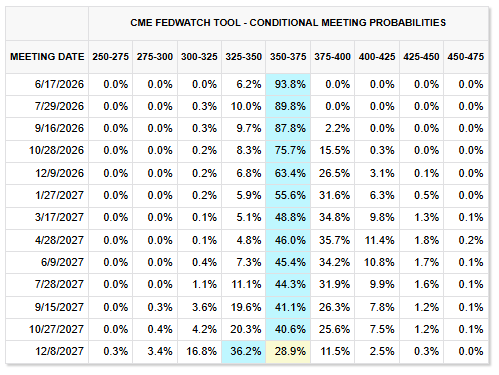
Source: CMEGROUP
This environment has begun to directly impact the bond market, where yields continue to show elevated levels and a consistent upward trend globally.
Currently, US 10-year Treasury yields remain above 4.4%, European yields are approaching 3.5%, UK yields have surpassed 5.00%, and Canadian yields are around 3.6%. Beyond the levels themselves, what stands out is that all of these markets are showing rising yield trends, driven by the restrictive outlook from central banks.
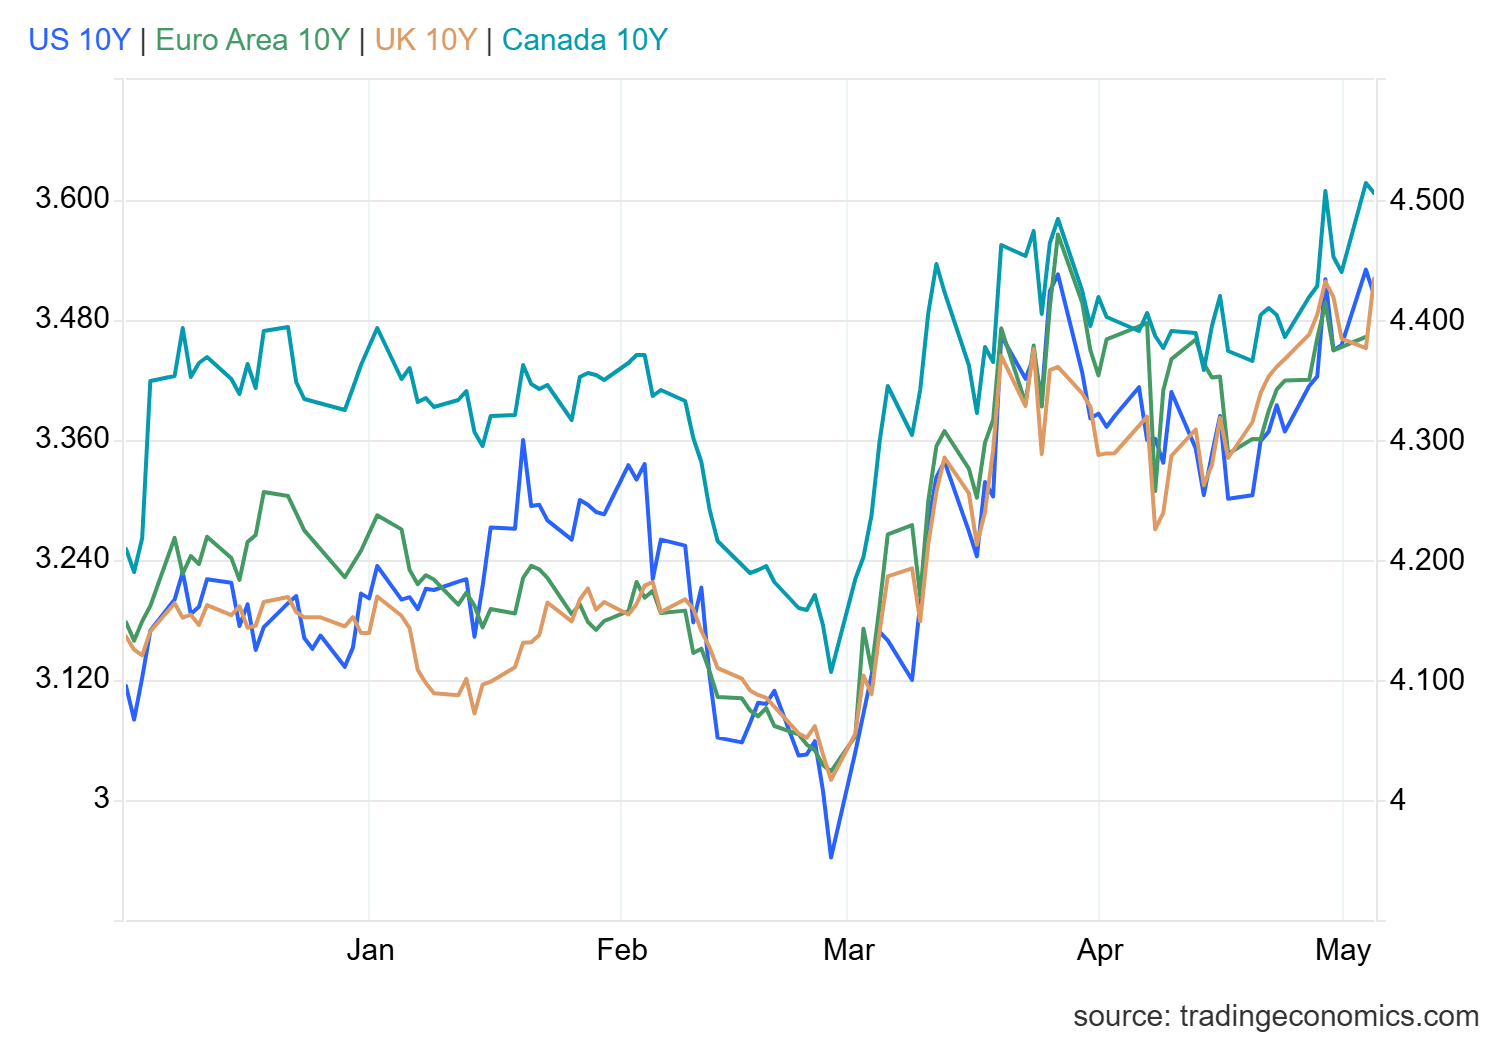
Source: TradingEconomics
In this context, a high-rate environment is not favorable for gold, as, unlike bonds, the metal does not generate yield. As interest rates rise, the relative attractiveness of bonds increases, diverting capital flows that might otherwise move into gold and reinforcing bonds as the primary substitute asset for the metal globally.
In fact, this dynamic is already reflected in market activity. The SPDR Gold Shares ETF continues to show steady capital outflows, with recent data indicating withdrawals of nearly $500 million as of April 30, 2026.
This suggests that demand for gold remains limited and that part of this weakness may be directly linked to the growing attractiveness of the bond market in the short term.
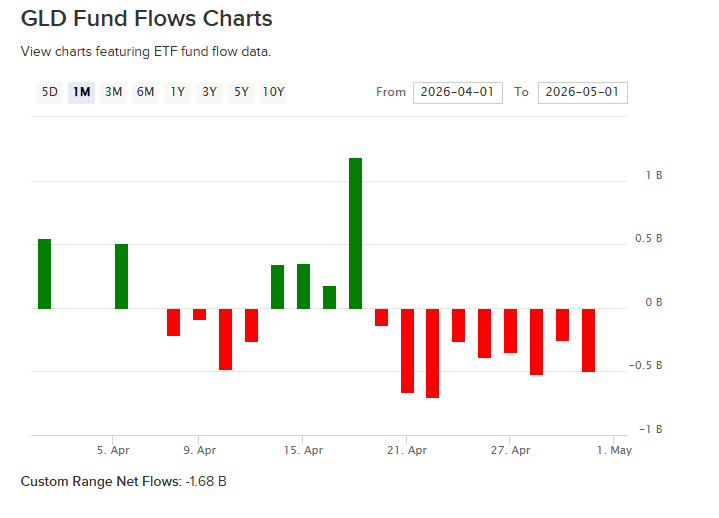
Source: ETFBD
Taking all the above into account, bond market dynamics remain one of the main factors limiting gold’s recovery. As long as yields remain elevated or continue trending higher, XAU/USD is likely to face difficulty in establishing a sustained recovery, maintaining a phase of indecision in the coming sessions.
Technical outlook for Gold
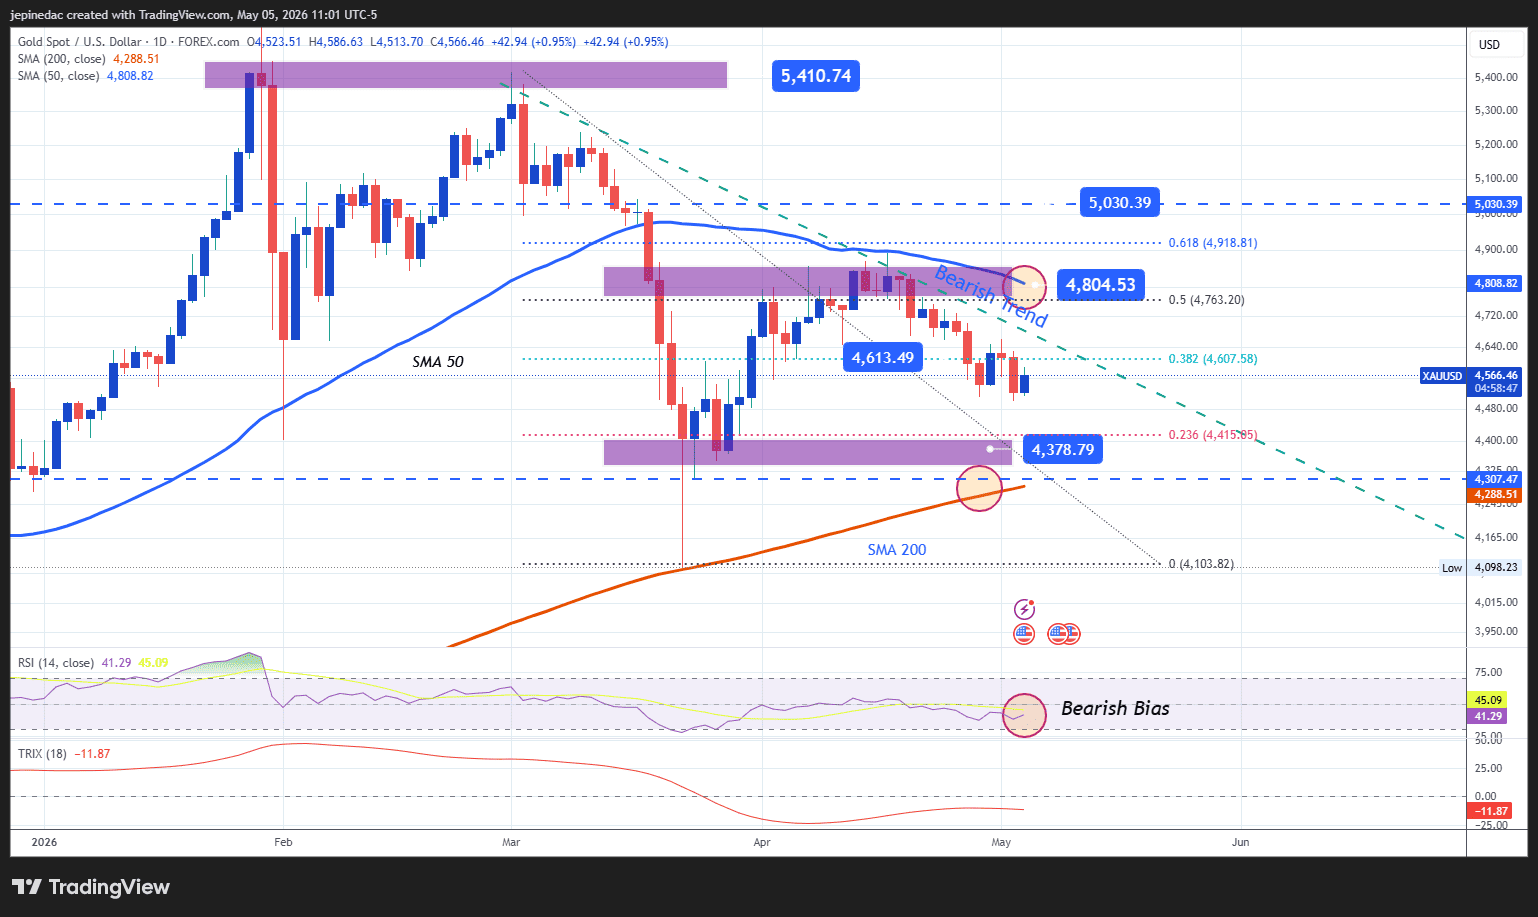
Source: StoneX, Tradingview
- Nothing is stopping the new bearish trendline: Since early March, a bearish trendline has been forming in gold, and in the absence of strong bullish moves, this structure continues to dominate the chart. Despite some recovery attempts, price has not managed to break this formation, and if selling pressure stabilizes again, this trend is likely to remain the main pattern in the coming weeks.
- RSI: The RSI remains slightly below the 50 level, indicating that bearish momentum remains dominant in the short term. If the indicator continues to decline, it could reinforce the emergence of stronger selling pressure in gold price action.
- TRIX: The TRIX indicator shows a similar dynamic, with the line below the zero level, suggesting that the strength of exponential moving averages remains in bearish territory. This reinforces the view that selling pressure has not fully disappeared.
Key levels to watch:
- 4,800 USD – Key resistance: A level of recent highs aligned with the 50-period moving average and the 50% Fibonacci retracement. A move above this zone could challenge the current bearish trend and open the door to a more consistent bullish bias.
- 4,613 USD – Near-term barrier: A neutral zone that has acted as a retracement point in recent weeks and aligns with the 38.2% Fibonacci level. Price action around this level could reinforce a sideways phase or even lead to the formation of a short-term range.
- 4,378 USD – Key support: A level of recent lows that acts as the main downside barrier. A move toward this area could reactivate selling pressure and reinforce the bearish trendline as the dominant structure in the coming weeks.
Written by Julian Pineda, CFA, CMT – Market Analyst
Follow him on: @julianpineda25




