


Weekly Technical Trade Levels on USD Majors, Commodities & Stocks
- USD technical trade setups we are tracking into the start of the week / month.
- Major event risk on tap with the RBA, ECB & BoE rate decisions on tap ahead of NFPs
- Next Weekly Strategy Webinar: Monday, February 9 at 8:30am ET
- Review the latest Video Updates or Stream Live on my YouTube playlist
In this webinar we take an in-depth look at the technical trade levels for the US Dollar (DXY), Euro (EUR/USD), British Pound (GBP/USD), Australian Dollar (AUD/USD), Canadian Dollar (USD/CAD), Japanese Yen (USD/JPY), Swiss Franc (USD/CHF), Gold (XAU/USD), Crude Oil (WTI), and Bitcoin (BTC/USD), and S&P 500 (SPX500), Nasdaq (NDX), and Dow Jones (DJI). These are the levels that matter on the technical charts into the weekly / monthly open.
Australian Dollar Price Chart – AUD/USD Daily
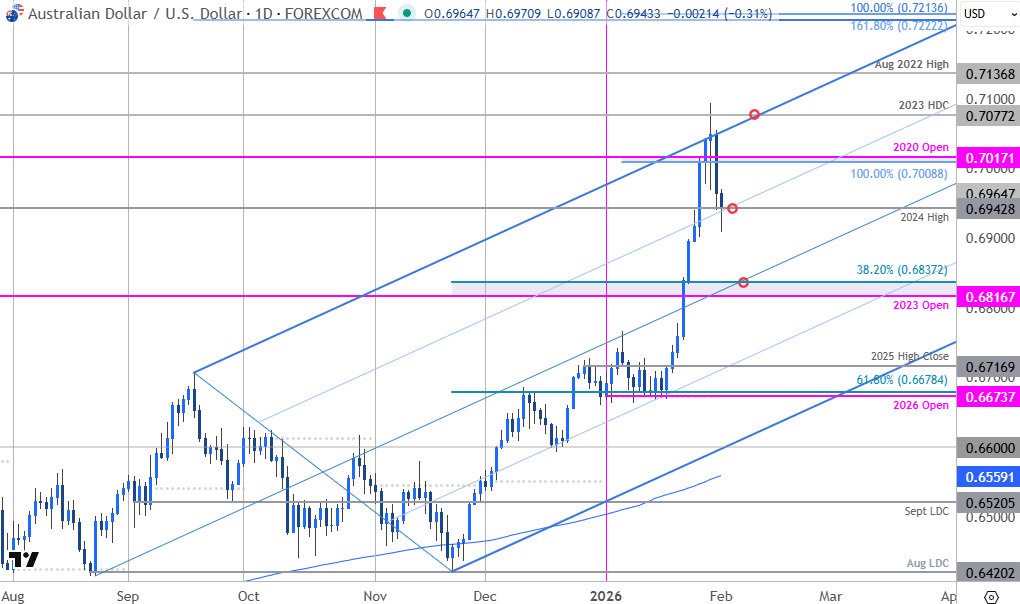
Chart Prepared by Michael Boutros, Sr. Technical Strategist; AUD/USD on TradingView
Notes: AUD/USD exhausted into the 2023 high-day close last week at 7077 with price unable to mark a daily close above uptrend resistance. A decline of more than 2.6% is now testing initial support at the 2024 high which converges on the 75% parallel near 6943. A break below this slope would threaten a larger pullback within the broader uptrend with subsequent support seen at the 6817/37- a region defined by the 2023 yearly open and the 38.2% retracement of the November advance. Look for a bigger reaction there IF reached.
Initial resistance is eyed at the 100% extension of the November rally at 7009 with a breach / close above the 7077 ultimately needed to fuel the next major leg of the advance.
Bottom line: Aussie has responded to uptrend resistance with the pullback now testing initial support ahead of tonight’s RBA rate decision. The central bank is widely expected to hike rates by 25bps, and the focus will be on the accompanying commentary. From a trading standpoint, rallies should be limited to 7009 IF price is heading for a deeper setback on this stretch with a close below 6943 needed to keep the bears in control near-term.

Bitcoin Price Chart – BTC/USD Daily
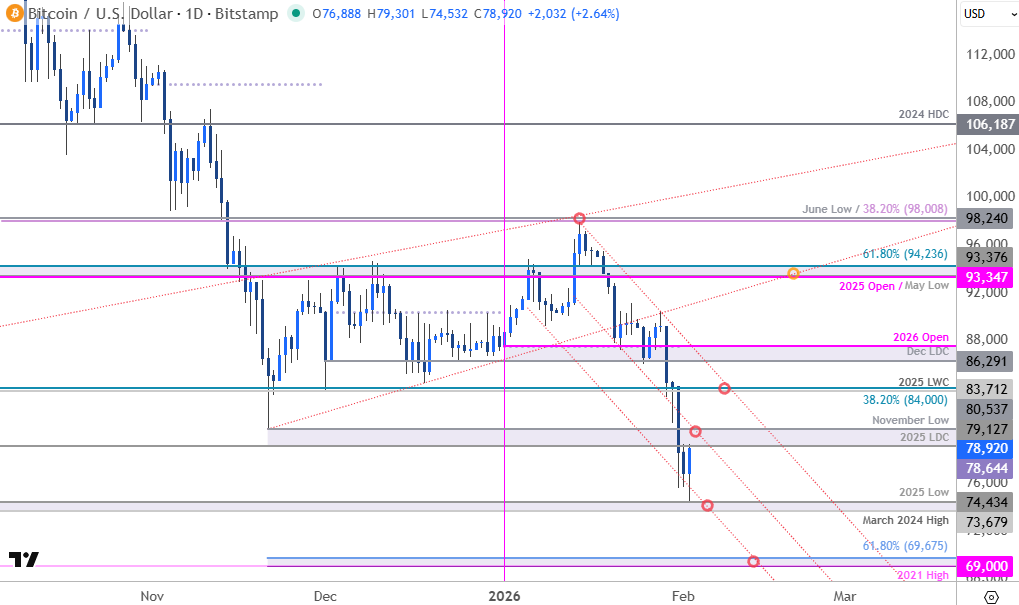
Chart Prepared by Michael Boutros, Sr. Technical Strategist; BTC/USD on TradingView
Notes: Bitcoin has plunged nearly 24% off the January high with the decline rebounding today off support at the March 2024 high and the 2025 low at 73,679-74,434. Initial resistance is being tested today at the 2025 low-day close (LDC) and the November low at 79,127-80,537 with medium-term bearish invalidation now lowered to 83,712-84,000- a region defined by the 38.2% retracement of the 2022 advance and the 2025 low-week close (LWC).
A break below this pivot zone would expose the next major support objectives at the 2021 high and 61.8% extension of the October decline at 69,000/675. Look for a larger reaction there IF reached.
Bottom line: Bitcoin is rebounding off support early in the week and the immediate focus is on this near-term recovery. From a trading standpoint, rallies should be limited to 84,000 IF price is heading lower on this stretch with a close below 73,679 needed to fuel the next leg of the decline.
Oil Price Chart – WTI Daily
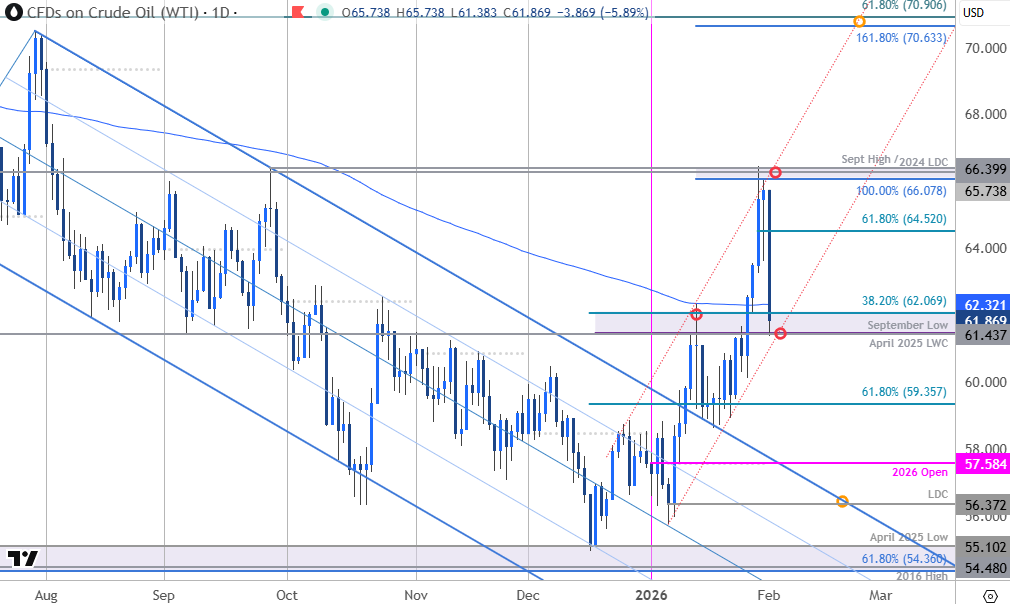
Chart Prepared by Michael Boutros, Technical Strategist; WTI on TradingView
Note: Last week’s oil breakout failed at confluent uptrend resistance bear 66.08/40- are region defined by the 100% extension of the December advance, the 2024 low-day close (LDC), and the September swing high. WTI has plunged more than 7.6% off those highs with the decline testing support into the start of the week / month at the April 2025 low week close (LWC) and the 38.2% retracement of the December rally at 61.43-62.07. Looking for a reaction off this mark in the days ahead for guidance.
A break below the January channel would be needed to suggest a more significant high is in place and a larger correction is underway with subsequent support seen at the 61.8% retracement at 59.36 and the yearly open at 58.58. Ultimately, a break / close below the LDC at 56.37 is needed to mark resumption of the broader downtrend in oil.
Initial resistance is eye with the 61.8% retracement of the recent drop at 64.52 with a topside breach above 66.40 needed to fuel the next leg of the rally. The next major technical consideration is eyed at the 1.618% extension and the 61.8% retracement of the 2025 trading range at 70.63/91.
Bottom line: WTI is testing pivotal support into the start of the month at lower bounds of the January uptrend- risk for price inflection here. From a trading standpoint, rallies would need to be limited to 64.52 IF price is heading for a deeper setback on this stretch with a close below the January uptrend needed to fuel the next leg lower.
Economic Calendar – Key Data Releases
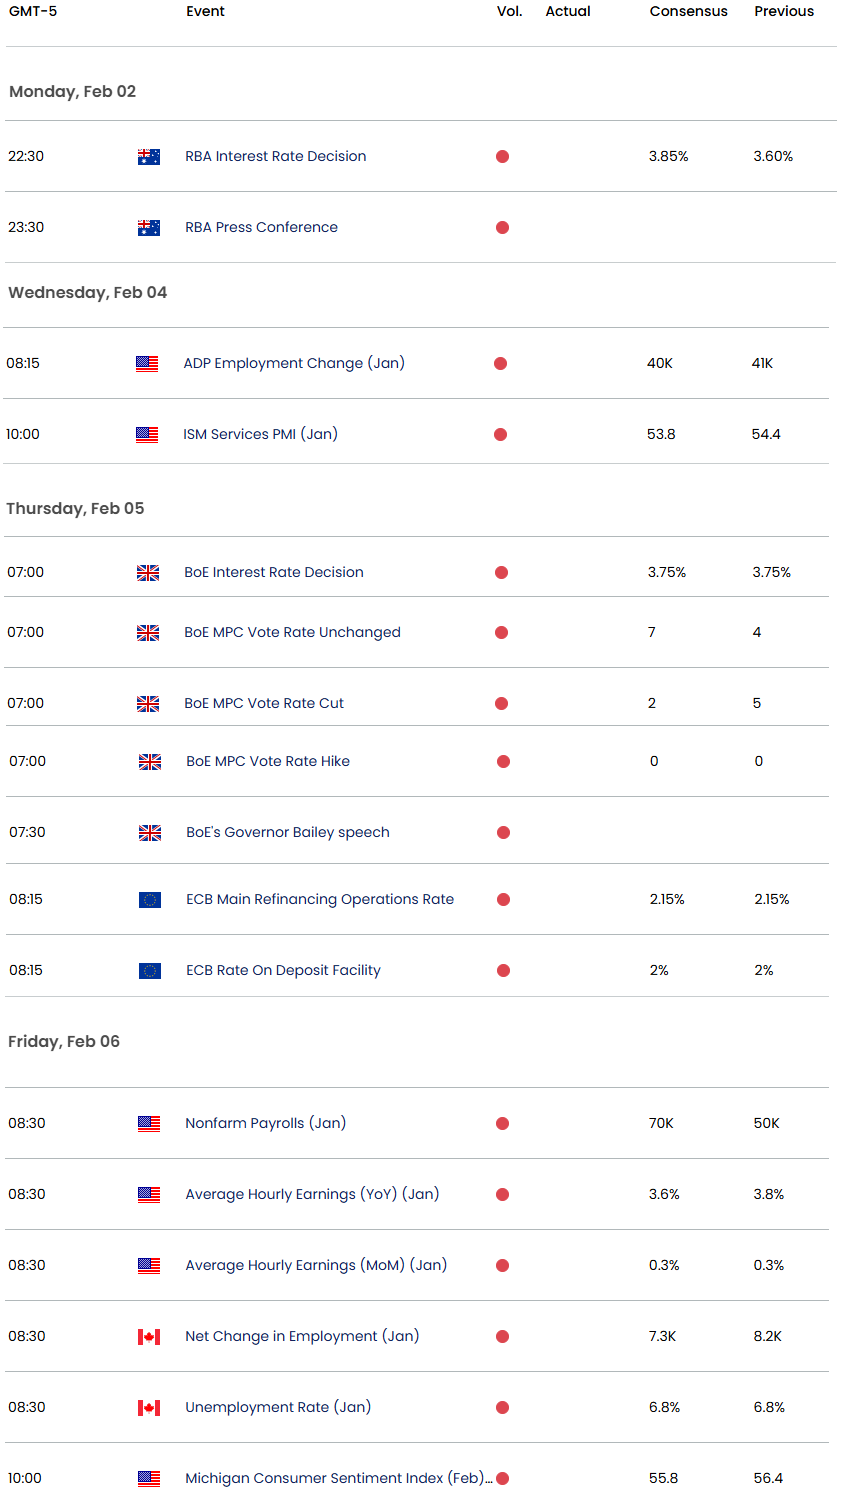
Economic Calendar - latest economic developments and upcoming event risk.
--- Written by Michael Boutros, Senior Technical Strategist
Follow Michael on X @MBForex




