Gold Explodes To 5 Year High Post FOMC

During a busy session for Asia and no less than three dovish central banks, gold exploded to a 5-year high and stopped just shy of $1400. With an increasingly bullish trend structure on the monthly charts, we remain bullish after prices have had a chance to pause for breath.
The Fed had confirmed their dovish stance nearer the end of the US session, with nearly half of the voting FOMC members expecting two cuts this year. Shortly after, RBA’s Philip Lowe hit the wires to hammer home their dovish views and all but confirm another cut is on the horizon. And, let’s not forget that RBA teased the notion of QE in their June minutes, adding that “Lower interest rates were not the only policy option available to assist in lowering the rate of unemployment”. Not wanting to miss out, BOJ reiterated their ultra-easy policy and expect to keep ‘extremely low rates at least through spring 2020’. Given the backdrop of trade wars and deteriorating economic data, the pressure if building for BOJ to stimulate the economy further. And, of course this is all after Draghi shot down the Euro with potential for ECB to ease further, earlier this week.
Put together, the demand for gold has shot through the roof and pushed the yellow metal to an intraday 5-year high.

Starting with the bigger picture, we can see on the monthly chart that the fall from the all-time high stopped around the 50% retracement level, before grinding higher since the 2016 low. However, a series of higher lows have formed to show demand picking up into the 2014 high. Whilst this timeframe I too large to trade for many, the bigger picture suggests gold is trying to return to its secular bull-trend.
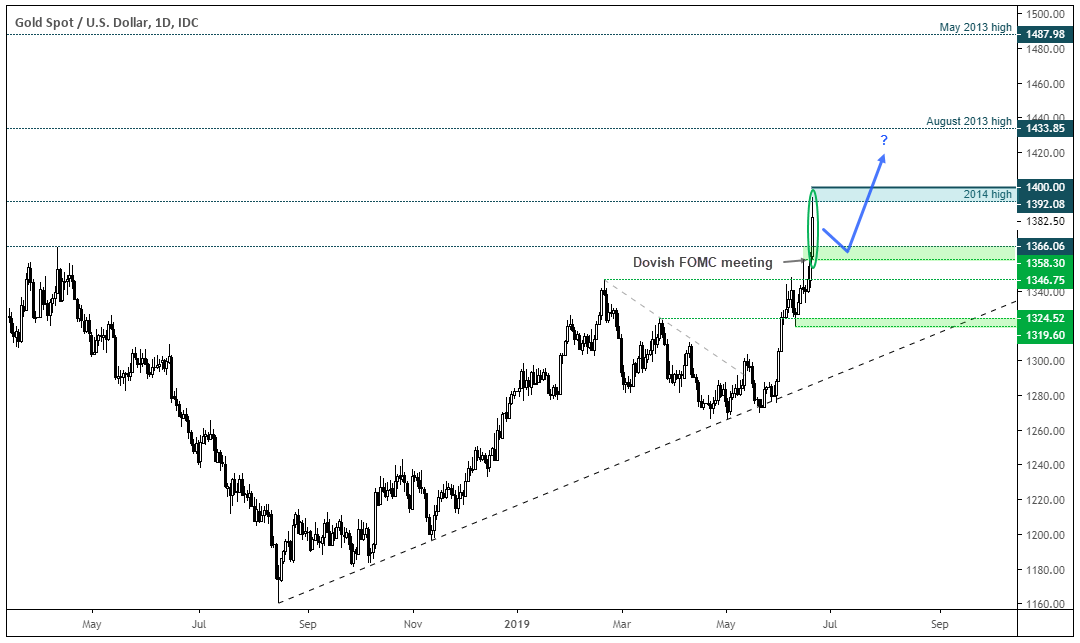
Switching to the daily chart shows the spike higher which momentarily touched a 5-year high. Given the strong fundamentals driving gold, we expect the trend to breakout in due course. However, gold appears technically over stretched over the near-term, especially since today’s high stopped just short of $1400 and has retreated below the 2014 high.
- Given the strong resistance below $1400, we’d like to see prices pause for breath and build a new level of support, on lower volatility.
- Ideally a retracement will form above the $1358.30 - $1366 zone before its next leg high.
- If it can clear $1400, the August and May 013 highs come into focus around $1433 and $1487 respectively.
Related Analysis:
FOMC Recap: Fed Doves Play Catchup With Markets
Gold poised for breakout as central banks depress yields
Weekly COT Report: Gold’s Net Long Exposure Hits A 14-Month High
A Glimmer Of Light For Gold
From time to time, StoneX Financial Pty Ltd (“we”, “our”) website may contain links to other sites and/or resources provided by third parties. These links and/or resources are provided for your information only and we have no control over the contents of those materials, and in no way endorse their content. Any analysis, opinion, commentary or research-based material on our website is for information and educational purposes only and is not, in any circumstances, intended to be an offer, recommendation or solicitation to buy or sell. You should always seek independent advice as to your suitability to speculate in any related markets and your ability to assume the associated risks, if you are at all unsure. No representation or warranty is made, express or implied, that the materials on our website are complete or accurate. We are not under any obligation to update any such material.
As such, we (and/or our associated companies) will not be responsible or liable for any loss or damage incurred by you or any third party arising out of, or in connection with, any use of the information on our website (other than with regards to any duty or liability that we are unable to limit or exclude by law or under the applicable regulatory system) and any such liability is hereby expressly disclaimed.
FOREX.com is a trading name of StoneX Financial Pty Ltd.
The material provided herein is general in nature and does not take into account your objectives, financial situation or needs.
While every care has been taken in preparing this material, we do not provide any representation or warranty (express or implied) with respect to its completeness or accuracy. This is not an invitation or an offer to invest nor is it a recommendation to buy or sell investments.
StoneX recommends you to seek independent financial and legal advice before making any financial investment decision. Trading CFDs and FX on margin carries a higher level of risk, and may not be suitable for all investors. The possibility exists that you could lose more than your initial investment and CFD investors do not own or have any rights to the underlying assets.
It is important you consider our Financial Services Guide and Product Disclosure Statement (PDS) available at www.forex.com/en-au/terms-and-policies/, before deciding to acquire or hold our products. As a part of our market risk management, we may take the opposite side of your trade. Our Target Market Determination (TMD) is also available at www.forex.com/en-au/terms-and-policies/.
StoneX Financial Pty Ltd, Suite 42.01, 264 George Street, Sydney, NSW 2000 (ACN 141 774 727, AFSL 345646) is the CFD issuer and our products are traded off exchange.
Delayed London Stock Exchange (LSE) Data
The London Stock Exchange (LSE) market data displayed or referenced on this website is provided on a delayed basis and is not in real time. The delay period may vary but is typically at least 15 minutes. This data is intended for information purposes only and should not be relied upon for trading, investment, or other financial decisions. We do not guarantee the completeness, reliability, or suitability of the data for any particular purpose. Users should consult real-time data sources and obtain professional advice before making any financial decisions.
© FOREX.COM 2026