


Gold prices have depreciated by more than 1.5% over the past two trading sessions, as market demand for safe-haven assets has diminished. For now, downward pressure on the precious metal remains steady, as the situation in the Middle East appears to have reached a tentative ceasefire agreement. As long as this agreement holds and continues to provide a sense of stability, selling pressure on XAU/USD could become more relevant in the short term.

What has happened with the Middle East conflict?
After twelve consecutive days of fighting, U.S. diplomatic pressure has helped broker a rapid ceasefire agreement between Iran and Israel, announced on June 24. Although tensions remain and both sides continue exchanging threats, the agreement has shown partial effectiveness so far, with both countries stating they will halt direct attacks.
Iran has expressed a willingness to negotiate on the condition that Israel refrains from further aggression and that clear terms are established. Notably, Iran also indicated its openness to resume nuclear talks with the United States. This stance was unexpectedly moderate, and markets welcomed the move, which had not been anticipated in the short term. As a result, the spotlight has now shifted toward diplomacy, and the United States will play a key role in steering this toward a real solution.
Still, it is important to note that the ceasefire is perceived as fragile, given the ongoing wave of mutual accusations between Iran and Israel. A strong diplomatic effort will be essential to prevent a new escalation, and it will be crucial to address deeper historical grievances between the two nations. Additionally, the conflict in Gaza remains active, which means full demilitarization in the region is far from a reality.
In this environment, gold has played a critical role. At the onset of the conflict, as uncertainty spiked, gold was heavily demanded as a safe haven, serving as a shield for capital in risk-off scenarios. Now that tensions have eased somewhat, gold has lost part of that appeal, becoming one of the catalysts behind the recent bearish pressure. However, the situation remains fragile, and gold has proven sensitive to renewed geopolitical tension. Should the ceasefire collapse and uncertainty return in the coming days, gold may once again benefit from a surge in demand, potentially reviving currently dormant buying pressure.
Sentiment behavior
The Fear and Greed Index, provided by CNN, has risen again and remains steadily within the "greed" zone, currently reading 63 points. In recent trading sessions, it has shown a consistent rebound, supported by the easing of the Middle East conflict, contributing to a gradual recovery in investor confidence.
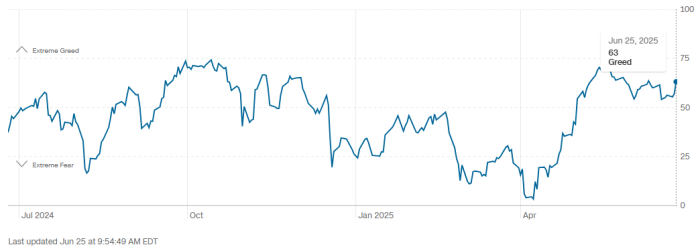
Source: CNN
The index suggests that perceived financial market risk is decreasing, reducing the appeal of safe-haven assets like gold and redirecting investor interest toward risk assets. As a result, gold has temporarily fallen out of favor. If this confidence trend continues in the coming sessions, it could become a negative factor for gold, potentially reinforcing further short-term selling pressure.
Gold Technical Outlook

Source: StoneX, Tradingview
- Lateral range begins to form: Although the long-term upward trendline remains intact, buying momentum has not been sufficient to break decisively above historical highs. Recent price movements have resulted in a clearer sideways range between $3,400 and $3,200 per ounce, signaling a possible shift toward technical neutrality in the short term.
- RSI: The RSI indicator has dropped to the 50 level, signaling a balance between supply and demand. This reflects the lack of a dominant market impulse. As long as RSI hovers near this level, indecision may continue, with gold remaining directionless.
- MACD: The MACD histogram shows slight bearish momentum, staying just below the zero line. Moving averages are also trending neutral, and unless the histogram begins to diverge meaningfully from the center, the chart is likely to preserve a state of broad indecision, with markets awaiting a clear catalyst.
Key levels to watch:
- $3,400 – Major resistance: This level marks the recent highs and the ceiling of the current range. A clear breakout would open the door to new all-time highs and revive long-term bullish sentiment.
- $3,300 – Current barrier: A psychological level that has served as the mid-point of the consolidation channel. Price action around this zone could prolong the sideways phase and delay market direction.
- $3,200 – Critical support: This level represents recent lows and forms the floor of the range. A break below could endanger the current bullish structure and tilt momentum in favor of sellers. If support holds, however, the sideways pattern will remain dominant.
Written by Julian Pineda, CFA – Market Analyst
Follow him: @julianpineda25




