
- Rising bond yields and firmer USD continue to pressure bullion
- Gold behaving more like a risk asset than a haven
- Correlations reinforce increasingly bearish macro backdrop
- $4500 support gives way as downside momentum builds
Bond Market Pressure Crushing Bullion
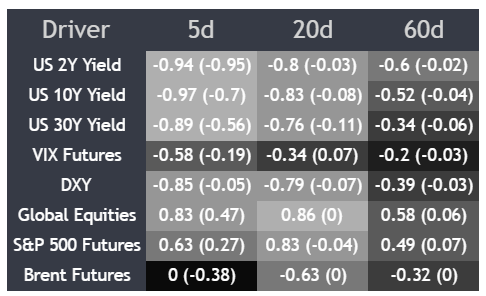
Gold is getting smoked right now as rising Treasury yields and a stronger dollar tighten financial conditions, with short-term correlations suggesting bullion is no longer trading like a traditional inflation hedge or haven.
Source: TradingView
The current regime is obvious. Over the past five and 20 trading days, gold has shown an extremely strong inverse relationship with US Treasury yields, especially US 10-year yields where the correlation sits at -0.97 over five days and -0.83 over 20 days. Gold also maintains a heavily negative relationship with DXY at -0.85 over five days and -0.79 over 20 days, while correlations with global equities remain firmly positive.
That’s not how a classic haven normally behaves.
The figures in brackets show the change over the past week, helping highlight how quickly relationships across markets can shift. Correlation coefficients measure the strength and direction of a relationship between assets, not causation.
Instead, gold is increasingly trading like a riskier macro asset, one highly sensitive to the direction of bond yields, the dollar and broader liquidity conditions. When both nominal and real Treasury yields rise together, like they are now, the opportunity cost of holding a non-yielding asset like gold increases sharply, especially when accompanied by a firmer dollar and tighter financial conditions.
$4500 Gives Way
Source: TradingView
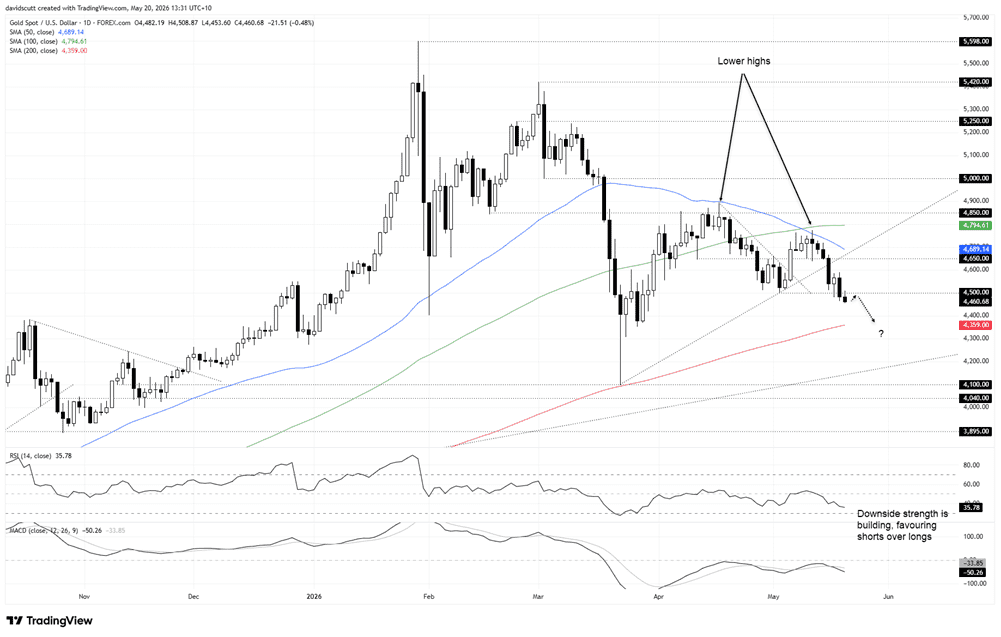
Gold has looked heavy for weeks, setting lower highs after repeated rejections at the 50-day moving average. Initial support at $4650 gave way before bullion sliced through the March uptrend like a hot knife through butter, eventually stalling at $4500 support.
But with risk appetite souring again in Asia alongside a firmer USD and elevated US yields, that level has now buckled, leaving the price trading at multi-month lows. We’ve already seen one back-test and rejection at $4500, making it a useful level to build bearish setups around should the price fail there again, allowing for shorts to be set with a tight stop above, targeting the 200-day moving average initially.
A break beneath that longer-term level would really start raising questions about gold’s broader trajectory, bringing uptrend support from the December 2024 lows and horizontal support around $4100 into focus on the downside.
Of course, if the price were to reclaim $4500 support and hold there, it could open the door for countertrend longs with a tight stop beneath for protection, initially targeting a move back towards $4650.
However, the oscillators continue to send an increasingly bearish signal. RSI (14) is trending lower below 50 without yet reaching oversold territory, while MACD has staged a bearish crossover and continues to push deeper into negative territory.
The combined signal suggests downside momentum is building, favouring short setups over longs.