
- Warsh's inflation credentials face renewed scrutiny
- Financial conditions tighten but remain accommodative overall
- Gold's traditional market correlations have reversed
- $4,000–$3,942.55 support zone remains critical
Gold is sitting just above a major support zone in an environment where, under normal circumstances, it would often be flying. US real yields have declined sharply, albeit remaining at elevated levels, the dollar has softened a little, and the Fed's commitment to bringing inflation back to target has yet again come under scrutiny. Yet despite those apparent tailwinds, bullion has struggled to bounce.
The question is whether the price action reflects temporary factors, including forced liquidation in other asset classes and month-end positioning, or whether something more significant is suppressing its ability to recover. With gold now moving in line with its historic nemeses, being US Treasury yields and the dollar, it creates more confusion than clarity.
Fed talks tough, but actions fall short
While earnings results from Microsoft and Alphabet may have stolen the headlines in the equity universe, for other asset classes, Wednesday's key event was the Fed's October interest rate decision.
The Fed's decision to leave policy unchanged in a split 10–2 vote hardly came as a surprise. What markets expected was a hawkish hold, with Kevin Warsh setting the tone for a likely hike in December. Instead, while offering no explicit forward guidance, his commentary raised a few eyebrows, particularly on inflation at a time when price pressures remain acute.
Despite acknowledging that inflation was too high, economic growth was strong and business investment was expanding rapidly, Warsh repeatedly pointed to improving inflation expectations and market-based inflation compensation as signs that the Fed's efforts were working.
That's a lot of faith to place in expectations when inflation has remained above target for more than five years. And market-based measures are hardly beyond criticism, given the potential distortions created by years of central bank asset purchases and other interventions.
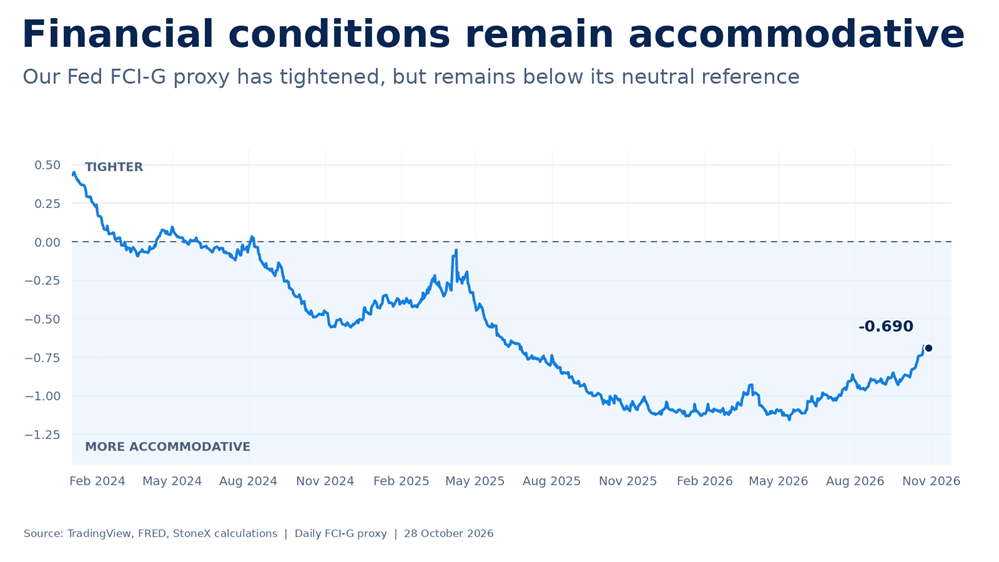
Warsh also highlighted tightening financial conditions as evidence that monetary policy was having its intended effect. There's merit to that argument, but our proxy for the Fed's Financial Conditions Impulse Index shows conditions have only become progressively less accommodative over recent months, not restrictive overall. At −0.690, the index remains firmly in accommodative territory.
Source: TradingView
Upon review, it felt like a reversion to the old Fed, just with a new leader, repeatedly promising to bring inflation back to target in the future without actually doing anything to do so.
The decision to reduce the number of policy meetings each year, starting from 2027, does little to extinguish that concern, providing longer gaps between actual rate decisions. While that fits with Warsh's view of wanting markets to do more of the work for the Fed, it only works if you don't have Fed officials constantly looking to influence market expectations, as we saw before this meeting.
Following September's rate increase, markets were heavily favouring a follow-up hike in October only for senior officials to start talking down those expectations. New York Fed President John Williams reverted to his former dovish self, arguing there was no urgency to raise rates again, while Governor Christopher Waller sowed the seeds for staggered increases, suggesting hikes weren't necessary at every meeting.
It meant the subsequent September CPI and PPI reports, which should have reinforced what markets were thinking beforehand, became almost irrelevant for Fed pricing, only reinforcing concerns about the bank's willingness to follow through on its inflation-fighting rhetoric.
Markets question Fed's inflation credentials
Perhaps I'm being a little cynical after watching the same old story play out for years. But judging by the market reaction to Warsh's press conference, I wasn't the only one questioning the central bank's commitment to restoring price stability.
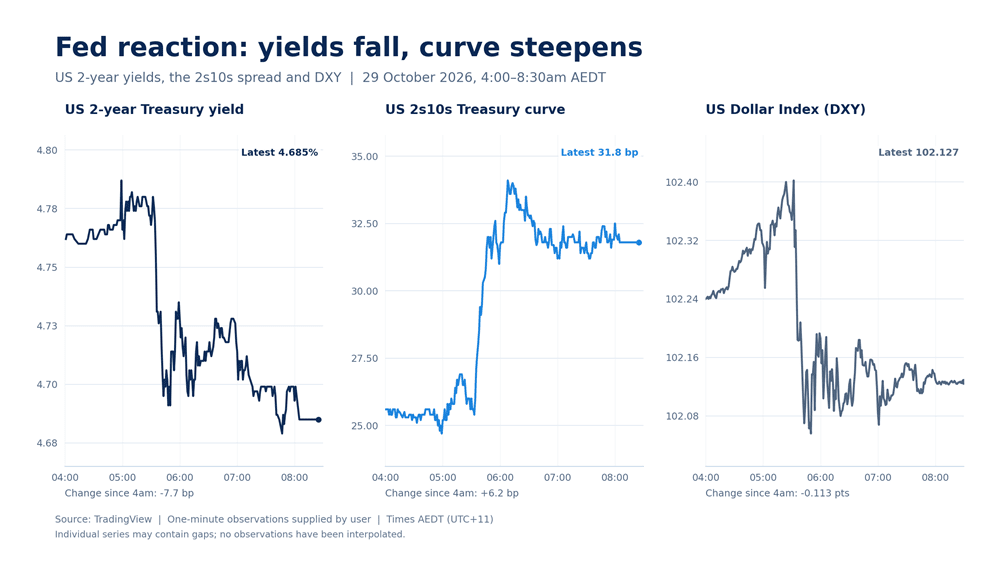
US two-year Treasury yields fell sharply, the 2s10s yield curve steepened and the dollar weakened, suggesting the Fed may have lost a little more of its inflation-fighting credibility.
Source: TradingView
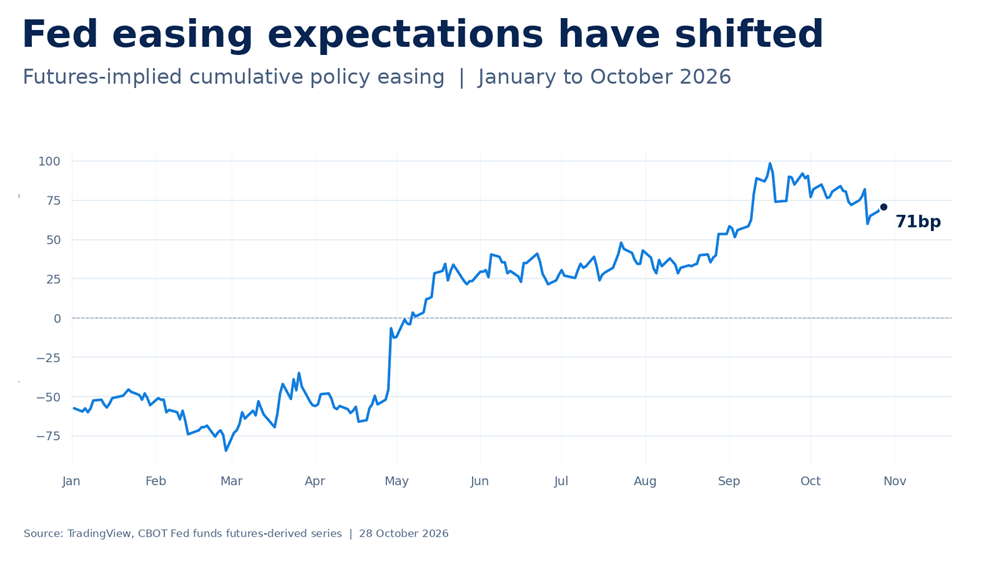
Importantly, the reaction did not come alongside a dramatic change in the amount of easing priced over the broader policy horizon. Fed funds futures continued to imply a relatively similar path for interest rates, suggesting the reaction wasn't simply about markets suddenly anticipating a substantially lower funds rate.
Source: TradingView
In an environment where questions are being raised about the Fed's willingness to deliver price stability, attention naturally turns to assets that have historically been used as inflation hedges, including gold.
Gold's traditional relationships turn upside down
While gold managed to climb during Wednesday's session, extending the rebound seen a day earlier, there wasn't much gusto behind the move, which was a tad surprising given what we've seen in similar periods in the past.
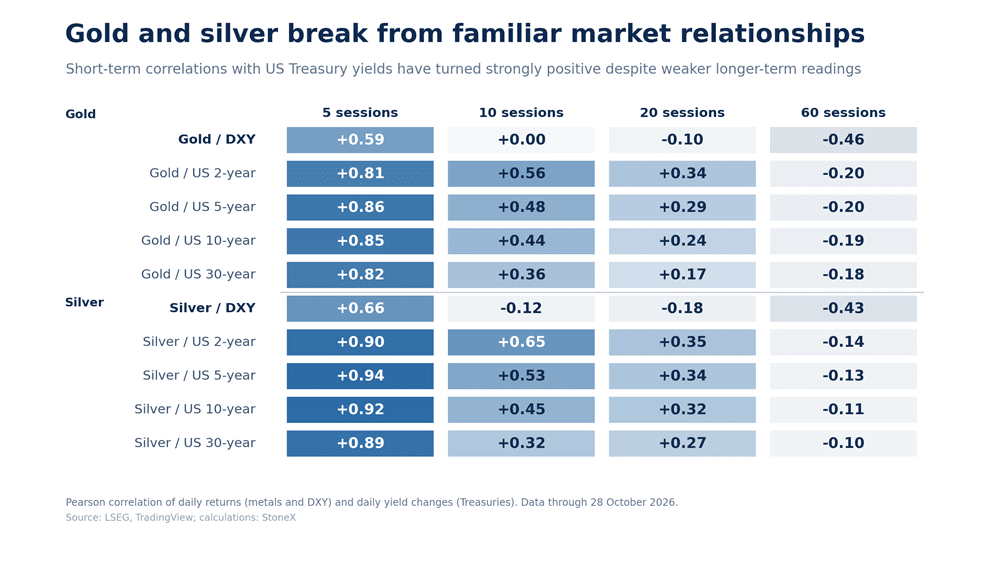
That may be explained by what we've seen recently when it comes to gold's historical relationship with the US dollar and US Treasury yields. Normally, you'd expect gold, which is priced in dollars and offers no yield, to move inversely to these markets. But what we've seen recently is that it's moving in the same direction, with the positive relationship strengthening over shorter timeframes.
Over the past five sessions, gold has maintained a positive correlation of 0.85 with daily changes in US ten-year Treasury yields, while its correlation with the dollar index stands at 0.59. The relationship with Treasury yields extends beyond the shortest window, with the 20-session correlation at 0.24, compared with a negative reading of −0.19 over 60 sessions.
Source: LSEG
As for what's going on there, you only need to look at the calendar and see that it's October 29, raising the possibility that month-end flows are playing a role. There have also been reports of gold being liquidated to cover losses in other asset classes, including short positions in Treasuries and technology stocks that were under the pump earlier this month.
Given gold has historically been heavily influenced by broader liquidity conditions, you could also make the case that dollar liquidity is tight at this point in time, contributing to its inability to bounce strongly. We don't have enough evidence to establish that, but it's another possibility worth considering.
Whatever's going on, it looks to be capping gold at a time when normally you'd expect it to be starting to catch a bid.
$4,000 remains the line in the sand
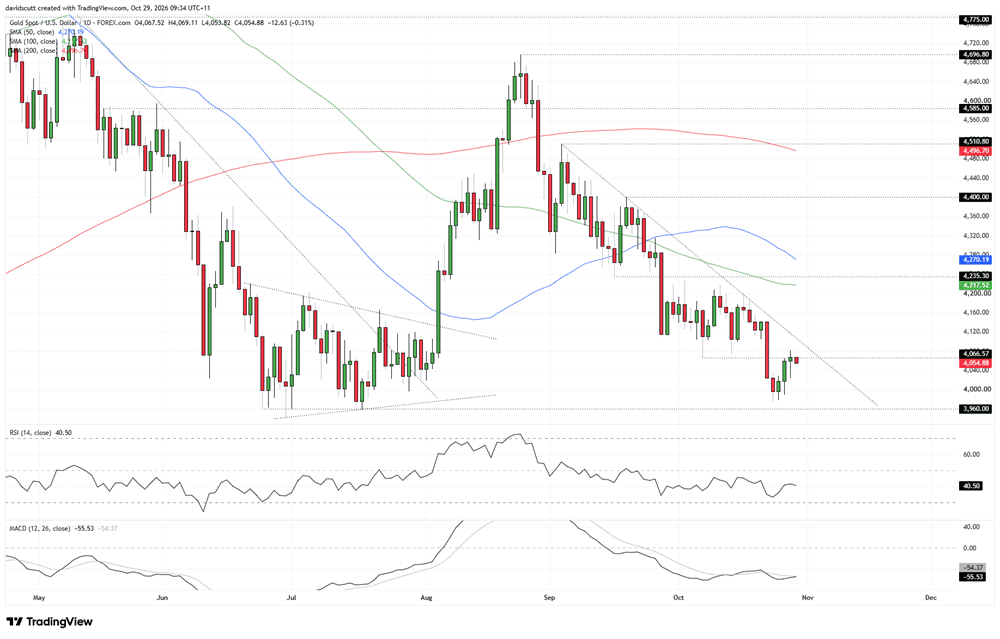
Source: TradingView
While gold has attracted bids beneath $4,000 again this week, as it did earlier this year, it's far too early to get excited about the prospect of a similar move to what we saw back in August.
The latest bounce stalled at $4,066.57, the low set on October 7, which now becomes the immediate focal point overhead. Below, $4,000 per ounce remains the key zone to watch.
The price action is still clearly bearish, with gold stuck in a downtrend beneath each of its medium and longer-term moving averages, all of which are negatively sloped. The oscillators also favour short setups over longs, with RSI (14) remaining beneath the neutral 50 level and showing signs of rolling over, while MACD continues to sit beneath its signal line in negative territory.
To start getting more excited about the prospect of an extended run higher, the price needs to not only climb and hold above $4,066.57, but also break the minor downtrend running from the highs set in early September.
If that were to take place, it could see gold push back towards $4,235.30, which previously acted as support before flipping to resistance, with offers clearly parked beneath it on pushes above $4,200 during September and October. The price has shown little interest in the 100-day simple moving average, but that's another level located around the same vicinity.
From a technical perspective, the picture remains decidedly bearish, putting greater emphasis on the broader support zone running from $4,000 down to $3,942.55. A break beneath that zone would bring $3,895, $3,791 and $3,700 into consideration.
However, from a medium to longer-term fundamental perspective, if this is the kind of environment the Fed is looking to foster, the outlook still looks pretty decent for gold and other hard assets with scarcity value, even if the technical picture suggests caution in the near term.