Key Events
• US CPI prints dropped below expectations, with CPI y/y at 2.4% and CPI m/m at 0.2%
• NFP printed at 7-month highs, capping gold and silver prices below the 5100 and 85 marks. CPI prints may reverse these trends
The latest US CPI print recorded an 8-month low, with CPI y/y dropping from 2.7% to 2.4% and CPI m/m easing from 0.3% to 0.2%, reinforcing rate cut expectations for the Fed. On the other side, the latest NFP report printed a 7-month high, with an addition of 130,000 jobs, signaling renewed economic momentum, holding DXY's grounds as markets reassess the timing of the next rate cut.

This fundamental shift redirected the US Dollar Index slightly below the 97 mark, gold toward the 5000 mark, and silver toward the 80 mark. Key levels remain in sight to confirm the sustainability of these trends, with respect to their primary structures.
Technical Analysis: Quantifying Uncertainties
Gold Outlook: Daily Time Frame – Log Scale
Source: Trading view
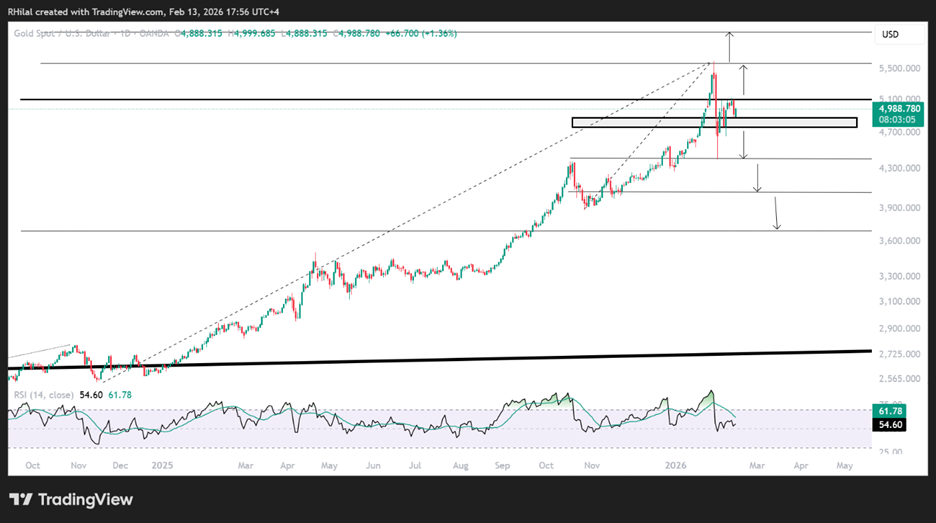
From a daily angle, we examine the corrective phase of the gold trend extending from the lows of November 2024 (2581) to the highs of January 2026, where gold prices are challenging the 5100 mark to extend gains back toward 5200 and 5600 and beyond, as defined in the 3-month time frame below. On the downside, taking the Fibonacci retracement of this trend, key levels are identified as potential targets should prices close back below 4800 and 4660, at 4500, 4390, 3930, and 3700 respectively.
Gold Outlook: 3 Month Time Frame – Log Scale
Source: Tradingview
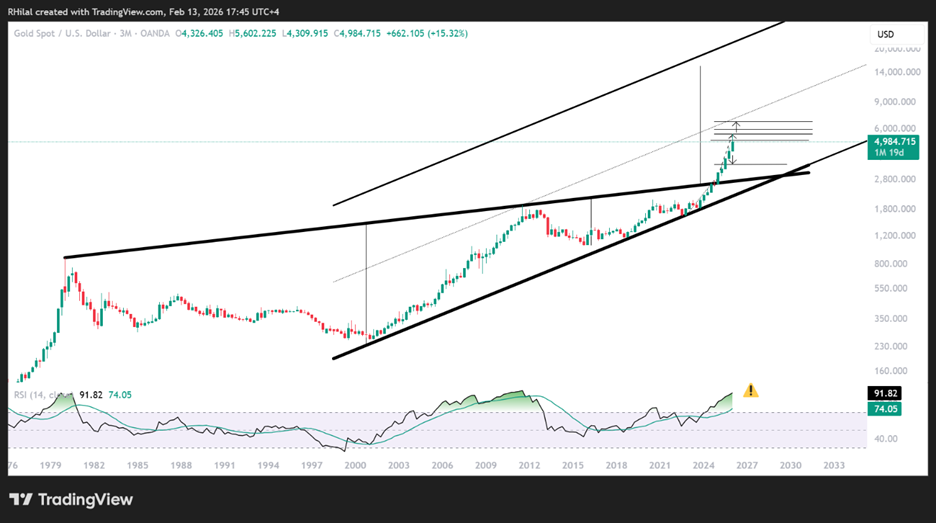
The primary structure, seen on the 3-month time frame remains in perspective given the extreme momentum levels and upside potential at the same time, directing prices above the 5600 mark toward 6000 and 6800, on track toward the 10,000 threshold from a long buy-and-hold perspective. Whereas on the downside, should a meaningful correction occur, the upper bound of this 45-year consolidation presents a dip-buying zone, with key levels in sight below 4390 and 3930 at 3700 and 3190 respectively.
Silver Outlook: Daily Time Frame – Log Scale
Source: Trading view
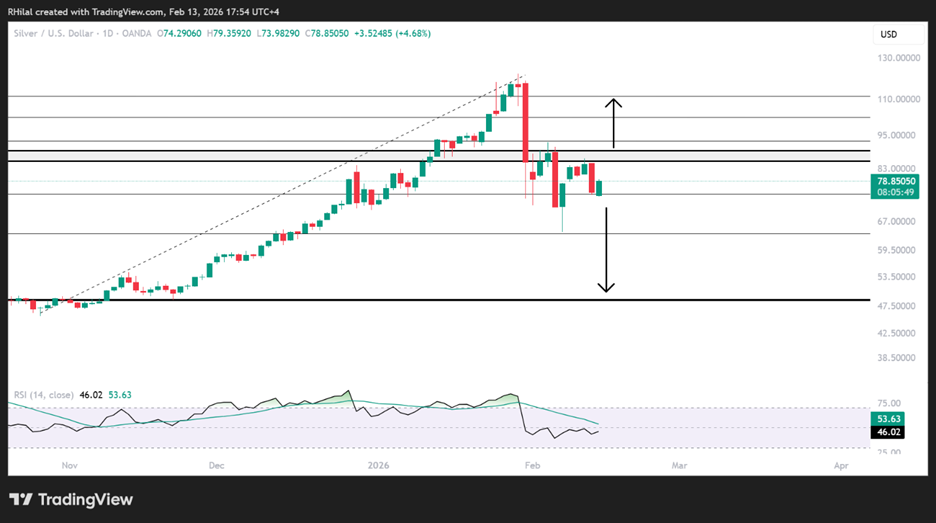
From a daily time frame perspective, we are looking at the corrective phase of the trend extending between the lows of October 2025 (45) and the highs of 2026 (120), where silver prices are challenging the 85 resistance zone to sustain highs once again toward the triple-digit levels, with key levels in sight at 93, 101, 110, and eventually 120. These levels are derived using the Fibonacci extension tool placed between October, January, and February price extremes. On the downside, a close back below the 70 and 65 levels would reinforce a drop toward the 55 zone, defined in the 3-month time frame below.
Silver Outlook: 3 Month Time Frame – Log Scale
Source: Trading view
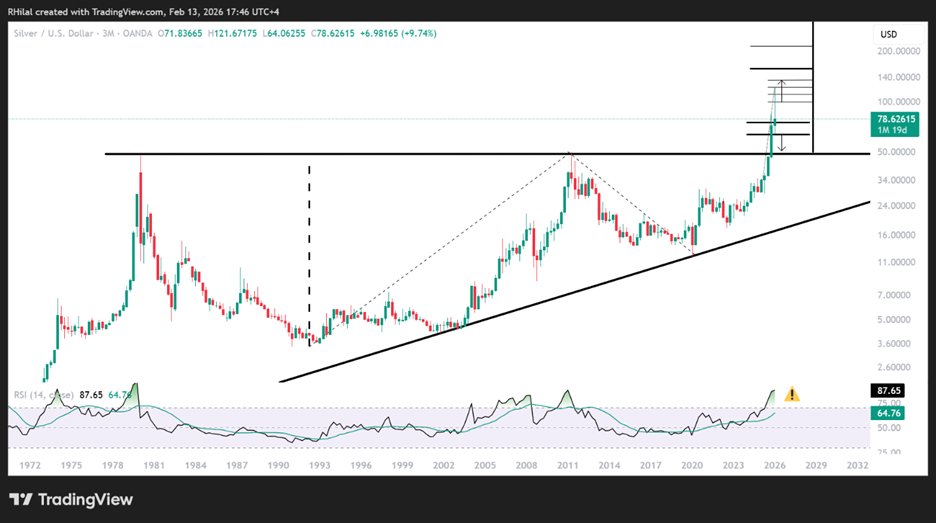
In line with gold’s primary structure, silver’s breakout potential points to new triple-digit heights near 200 and 600 respectively, should a weekly close be established beyond the 120 high. On the downside, should a notable drawdown and momentum reset occur across the markets, the upper bound of the 45-year consolidation stands as a potential dip-buying zone, with key levels in sight between 60, 55, and 48 respectively.
Written by Razan Hilal, CMT
Follow on X: @Rh_waves