


Gold and silver are tracing bullish breakout risks above their June-August consolidations as market optimism grows over a potential US-Iran deal. However, geopolitical risks continue to persist.
As silver breaks above $61 and gold reclaims $4,100, key developments to watch include:
- The DXY maintaining its position above its 2026 uptrend and the 99.30 support level. DXY analysis
- Crude oil holding above $70. Crude oil analysis
- Inflation uncertainty related to the prolonged disruptions across the Middle East remaining a key concern.
Should headlines continue to progress toward a sustainable resolution, market uptrends are expected to extend. However, any deterioration in negotiations could trigger significant downside risks as market sentiment quickly reverses.

To minimize headline noise, price action analysis helps clarify the technical scenarios ahead.
Gold Price Forecast: 6-Month Time Frame – Log Scale
Source: Trading view
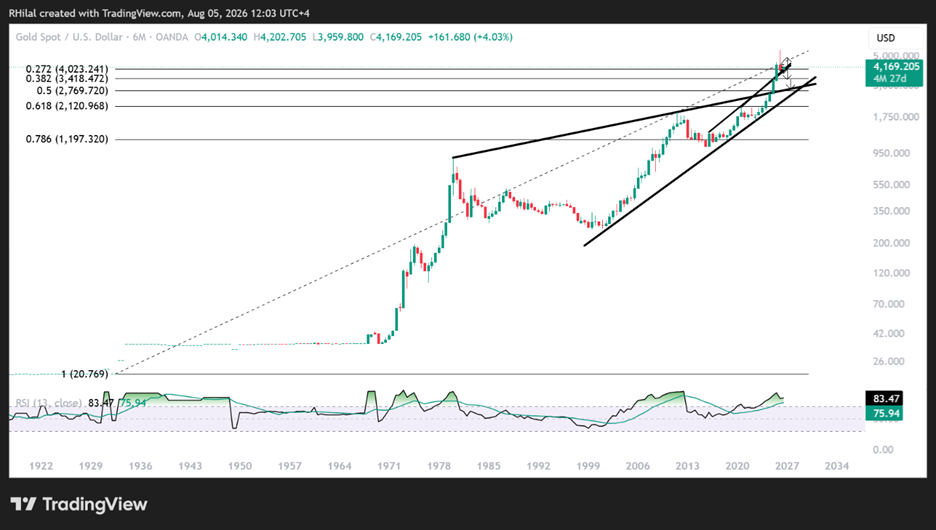
From a six-month perspective, gold is rebounding from one of the most significant technical confluence zones in decades.
- The 27.2% Fibonacci retracement of the secular advance from 1920 to 2026.
- The long-term trendline connecting the major highs recorded between 2016 and 2025. What previously acted as resistance has now become one of the market's most important long-term support levels in 2026.
- The close of a six-month shooting star reversal pattern.
However, given the significance of this support zone and the fragile nature of the US-Iran situation, a sustained break below this confluence and the 3,930 support level would expose the 38.2% Fibonacci retracement between 3,500 and 3,460, an area that acted as major resistance throughout much of 2025.
Whether gold continues its rebound from this area or extends its correction will largely depend on:
- Crude oil price direction. Crude Oil Outlook: What the 1973 Oil Embargo Tells Us About the 2026 Hormuz Crisis
- Developments surrounding the US-Iran conflict and the Strait of Hormuz.
- The Federal Reserve's policy outlook and US Treasury yields. US Dollar (DXY), USD/JPY Forecast: Key Levels to Watch
Gold Price Forecast: Daily Time Frame – Log Scale
Source: Trading view
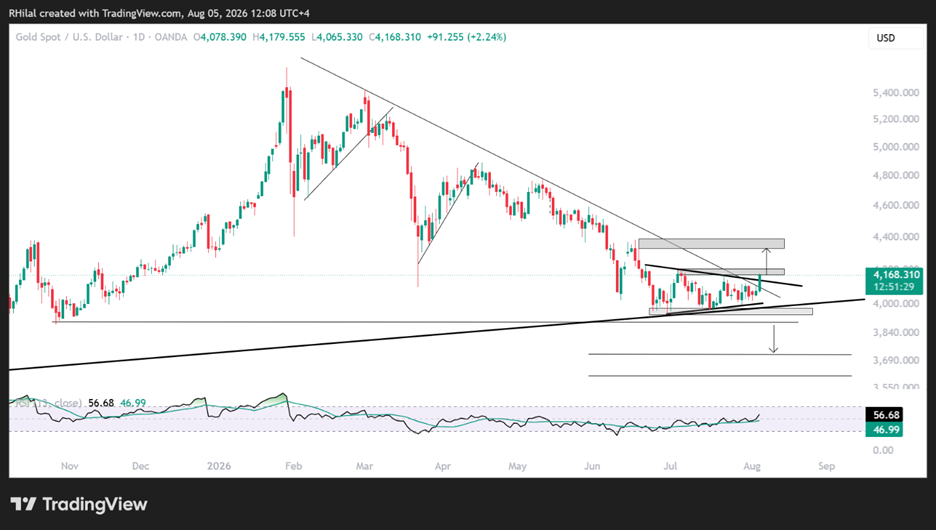
In line with the strength of this higher-time-frame support zone, gold is tracing a bullish breakout above the June-August contracting consolidation, ranging between 3,930 and 4,200, and above the descending resistance guiding price action since March 2026.
Key support: 3,960-3,930
Gold Bullish Scenario
A sustained recovery above 4,140 and 4,200 would shift the short-term outlook back in favor of buyers.
That would expose the next resistance levels near the 23.6 – 27.2% retracement of the yearly decline:
- 4,340
- 4,400
A breakout above 4,400 would strengthen the case for a broader recovery across precious metals while increasing confidence that the longer-term uptrend has resumed.
Meanwhile, the daily RSI continues to push into bullish territory, suggesting accelerating momentum.
Gold Bearish Scenario
On the downside, a break below the 4,020-3,960-3,930 support zone would reactivate the bearish scenario.
The next downside objectives are:
- 3,880-3,840, corresponding to the October 2025 lows.
- 3,700.
- 3,500-3,460, the well-respected five-month resistance zone throughout 2025 and the 38.2% Fibonacci retracement of the 1920-2026 advance.
These longer-term support zones could provide another significant reversal opportunity.
As long as the US Dollar Index and crude oil remain firm, downside risks across currencies and precious metals are likely to remain elevated.
Silver Price Forecast: 6-Month Time Frame – Log Scale
Source: Trading view
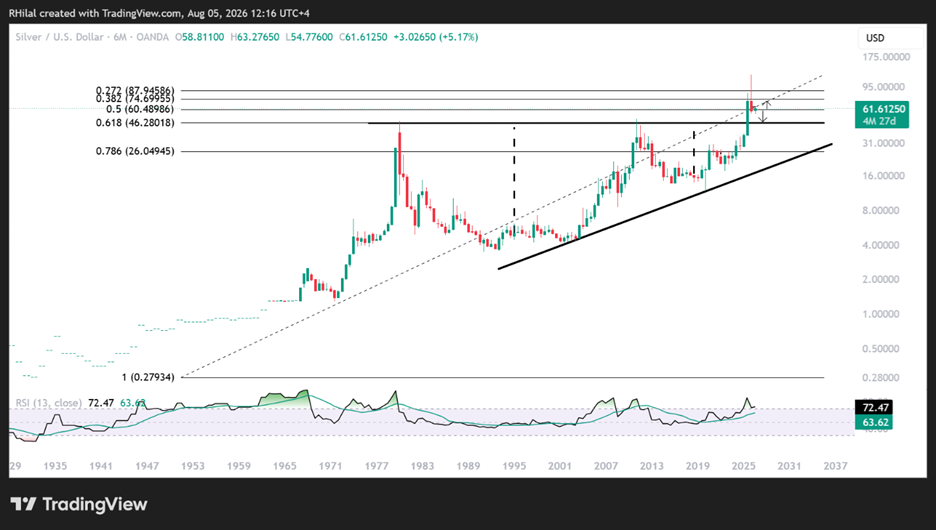
The six-month chart highlights several important long-term technical developments.
- A shooting star reversal candle.
- A hold near the 50% Fibonacci retracement of the secular advance from 1930 to 2026.
Price action facing the multi-decade trendline connecting the highs recorded between 1980 and 2024, which may now transition from long-term resistance into major support should another breakdown in silver prices occur below $55.
This area also aligns with the 61.8% Fibonacci retracement of the entire advance between $46 and $50.
The shorter-term outlook suggests signs of bullish recovery, which becomes clearer on the daily chart below.
Silver Price Forecast: Daily Time Frame – Log Scale
Source: Trading view
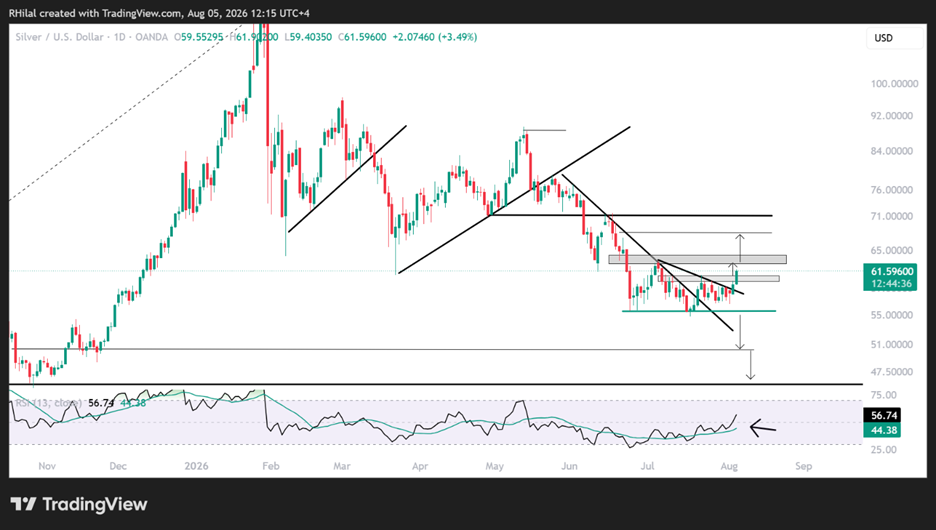
From a daily perspective, silver is attempting to stabilize above the descending trendline connecting the lower highs formed since May 2026, while also holding above the June-August consolidation and the $61 resistance level.
At the same time, momentum indicators continue pointing higher, remaining above the neutral 50 level and supporting the short-term bullish outlook.
- A breakout above $61 exposes $63.80, $68, and $72.
- A break below $55.50 would expose the longer-term support zone between $50 and $46.
Long-Term Outlook
A confirmed breakout above $72 would significantly strengthen confidence that a broader bullish reversal is underway, reopening the path toward triple-digit silver prices over the longer term.
Key Takeaway
The US Dollar Index (DXY) will remain one of the primary benchmarks for both the foreign exchange and precious metals markets as geopolitical risks and Federal Reserve expectations continue to evolve.
- The 101.80-102.00 resistance zone remains the key level to watch for upside risks in the dollar and downside risks across currencies and precious metals.
- The 99.30 support zone remains the key level to watch for downside risks in the dollar and upside risks across currencies and precious metals.
Written by Razan Hilal, CMT
Follow on X: @Rh_waves




