
Gold and silver are approaching important technical resistance levels following a strong rebound from yearly lows, over 400 points, while the US Dollar Index is testing the boundaries of its 2026 uptrend after its latest pullback near 99.30.
The combination is creating an increasingly important intermarket setup: precious metals are showing stretched daily momentum just as the dollar attempts to stabilize, raising the risk of a short-term reversal before the longer-term trends become clearer.
At the same time, persistent geopolitical uncertainty and fluctuating Federal Reserve rate expectations continue to influence the outlook across currencies, precious metals, and broader risk assets.
Key Catalysts Moving Markets
Several macro and technical factors are converging as markets approach levels that could help define the dominant trends heading toward Q4 2026:
- Federal Reserve expectations: Rate expectations continue to fluctuate, with markets facing further uncertainty ahead of the next US Non-Farm Payrolls and CPI reports due before the September Fed meeting.
- US-Iran tensions: Iran has indicated that no meaningful progress has been made in negotiations with the US, keeping geopolitical risk premiums elevated around Strait of Hormuz shipping and global energy markets.
- US Dollar resilience: The US Dollar Index continues to hold its broader 2026 uptrend, while USD/JPY is once again approaching the psychologically important 160 region.
- US equity momentum: Major US indices are trading with increasingly stretched longer-term momentum, raising the risk of short-term consolidation or corrective moves.
- Precious metals: Gold and silver are testing the projected targets of their June-August consolidation breakouts while daily momentum pushes deeper into overbought territory.
Given the combination of geopolitical uncertainty, shifting Fed expectations, and increasingly stretched momentum, several markets are now testing technical tipping points that could define their dominant trends heading into Q4.
Gold Outlook: Another Long-Term Bullish Leg?
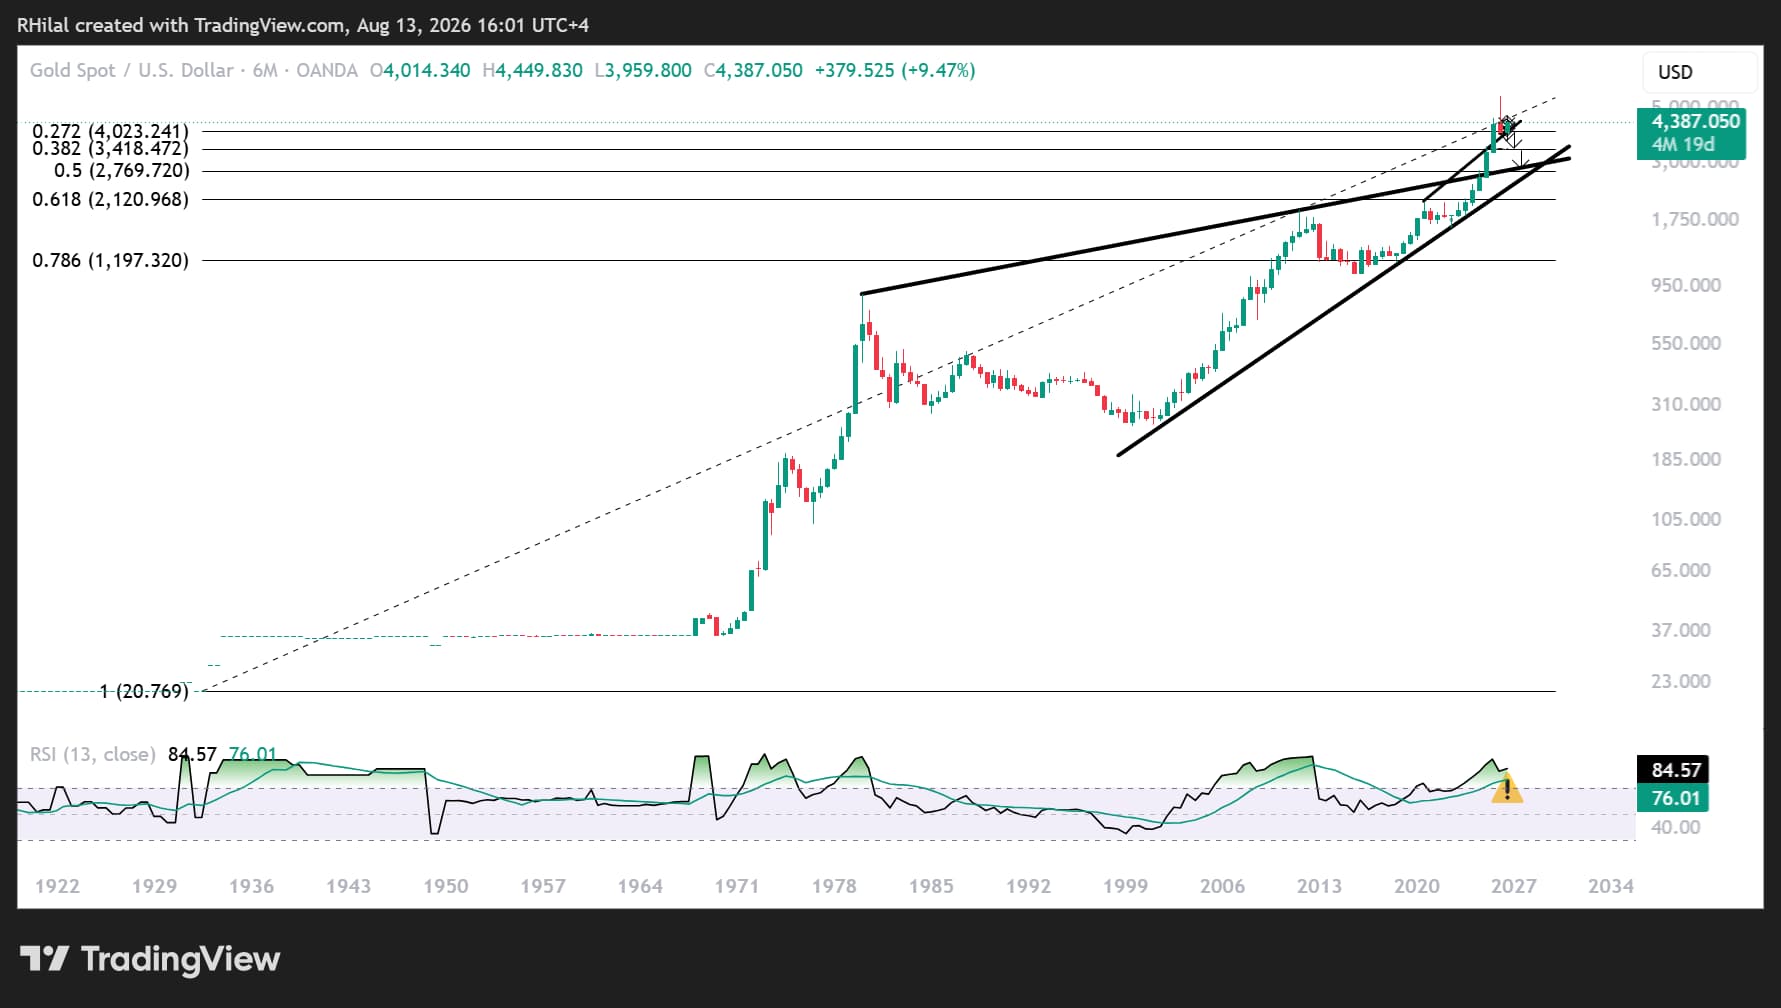
Gold Price Outlook: 6-Month Time Frame – Log Scale
Source: TradingView
From a six-month perspective, gold continues to rebound from one of its most significant long-term technical confluence zones in decades.
The area combines several important structural signals:
- The 27.2% Fibonacci retracement of the secular advance from 1920 to 2026.
- The long-term trendline connecting major highs between 2016 and 2025. What previously acted as resistance has transitioned into one of gold's most important long-term support areas in 2026.
- The completion of a six-month shooting-star reversal pattern, highlighting the significance of the corrective risks that emerged following the record highs earlier this year.
Given the importance of this technical confluence and the fragile US-Iran geopolitical backdrop, the longer-term structure remains particularly sensitive to the 3,930 support level.
A sustained break below 3,930 and the broader confluence zone would expose the 38.2% Fibonacci retracement around 3,500-3,460, an area that acted as major resistance throughout much of 2025.
Conversely, continued stabilization above this long-term support structure would preserve the broader bullish case, although short-term momentum conditions suggest another corrective phase may develop before confidence in a sustained long-term advance strengthens.
Gold Short-Term Trading Outlook
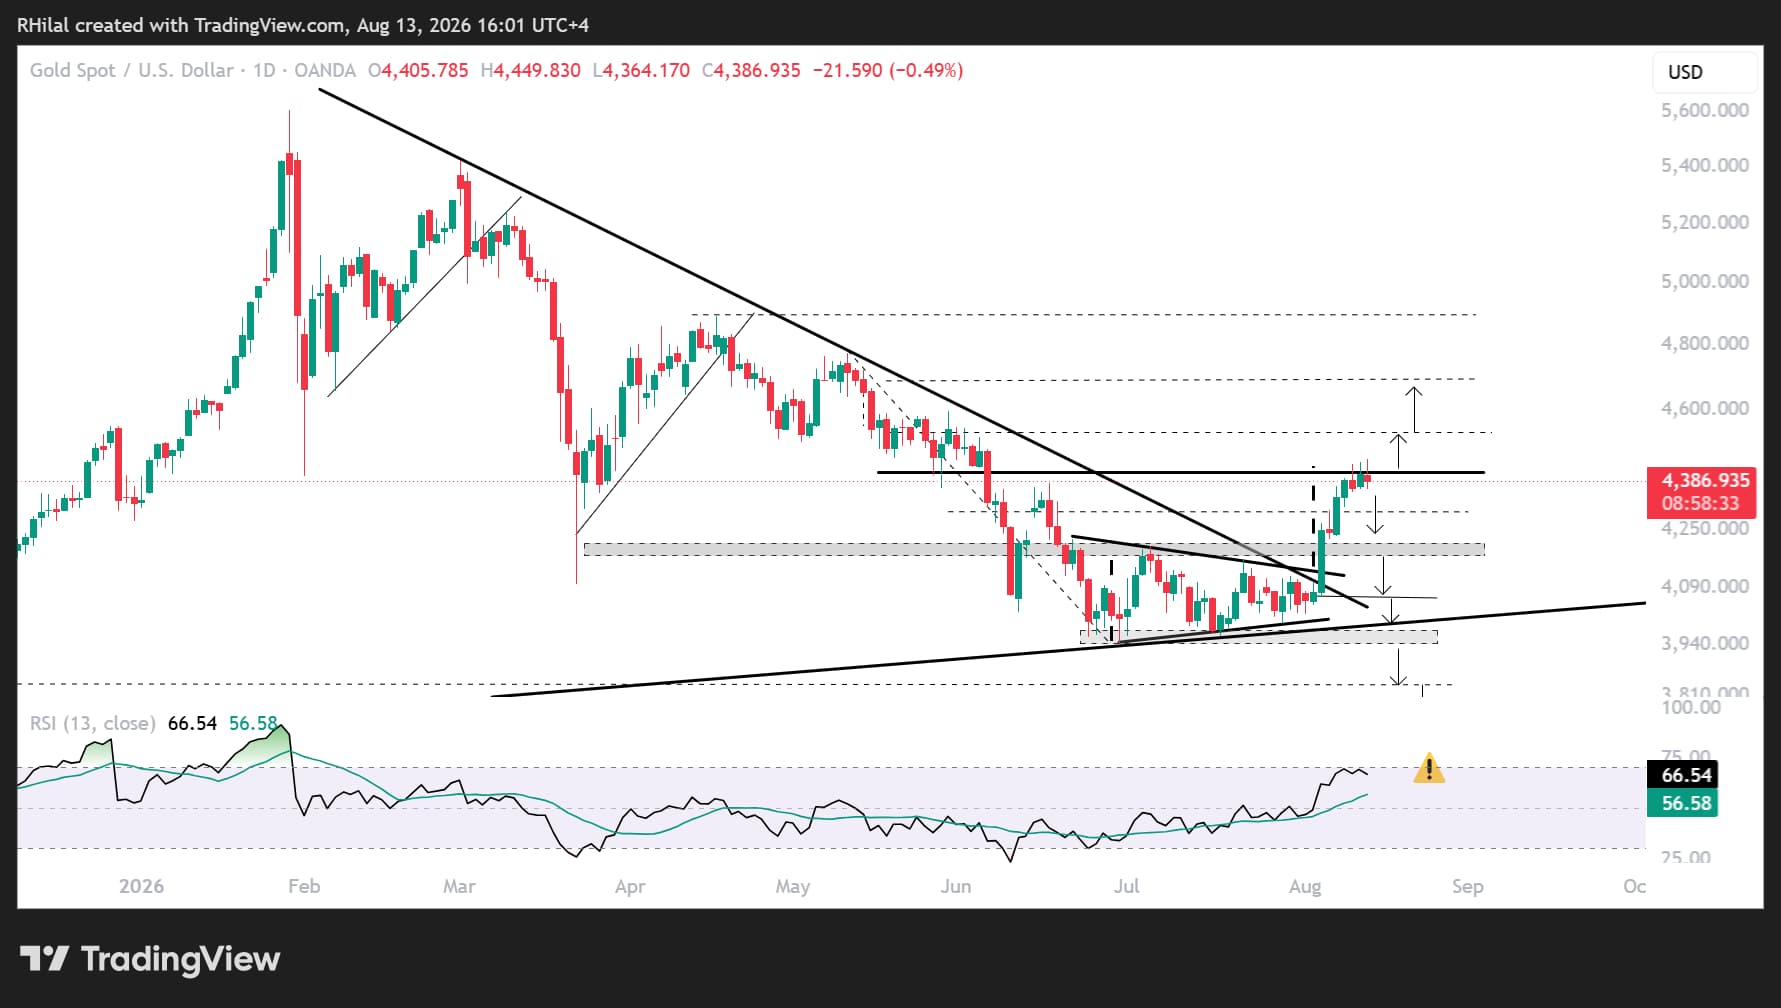
Gold Price Outlook: Daily Time Frame – Log Scale
Source: TradingView
From a daily perspective, gold is holding near the projected target of the June-August contracting consolidation breakout around 4,400, while remaining above the descending resistance that had guided price action since March 2026.
The breakout keeps the broader recovery structure intact, but increasingly stretched momentum raises the risk of a short-term pullback.
Gold Bullish Scenario
A sustained break above 4,470 would shift both the short- and longer-term outlooks further in favor of buyers.
The level aligns with the 50% Fibonacci retracement of the April-June decline, making it an important threshold for determining whether the current recovery can develop into a broader bullish advance.
A sustained move above 4,470 would expose:
- 4,530: 61.8% Fibonacci retracement.
- 4,700: 78.6% Fibonacci retracement.
- 4,900: 100% retracement and the final major technical test before confidence in a longer-term bullish continuation strengthens considerably.
However, the daily RSI continues to push deeper into overbought territory, reaching levels last seen in January 2026 when gold was approaching its 5,600 record high.
This does not invalidate the bullish breakout, but it does increase the probability of short-term consolidation or a corrective pullback before another potential upside extension.
Gold Bearish Scenario
On the downside, a break below 4,300 and 4,200 would weaken short-term momentum and expose the 4,140-4,160 region as another potential dip-buying zone.
Should this area fail to hold, gold could retest the broader 4,050-3,960-3,930 support zone.
A sustained breakdown below this region would reactivate the broader bearish scenario and expose:
- 3,880-3,840: Corresponding with the October 2025 lows.
- 3,700
- 3,500-3,460: The well-respected five-month resistance zone from 2025 and the 38.2% Fibonacci retracement of the 1920-2026 secular advance.
These longer-term support zones could provide significant reversal opportunities should a deeper correction develop.
As long as the US Dollar Index and crude oil remain firm, volatility and downside risks across currencies and precious metals are likely to remain elevated.
Silver Outlook: Another Long-Term Bullish Leg?
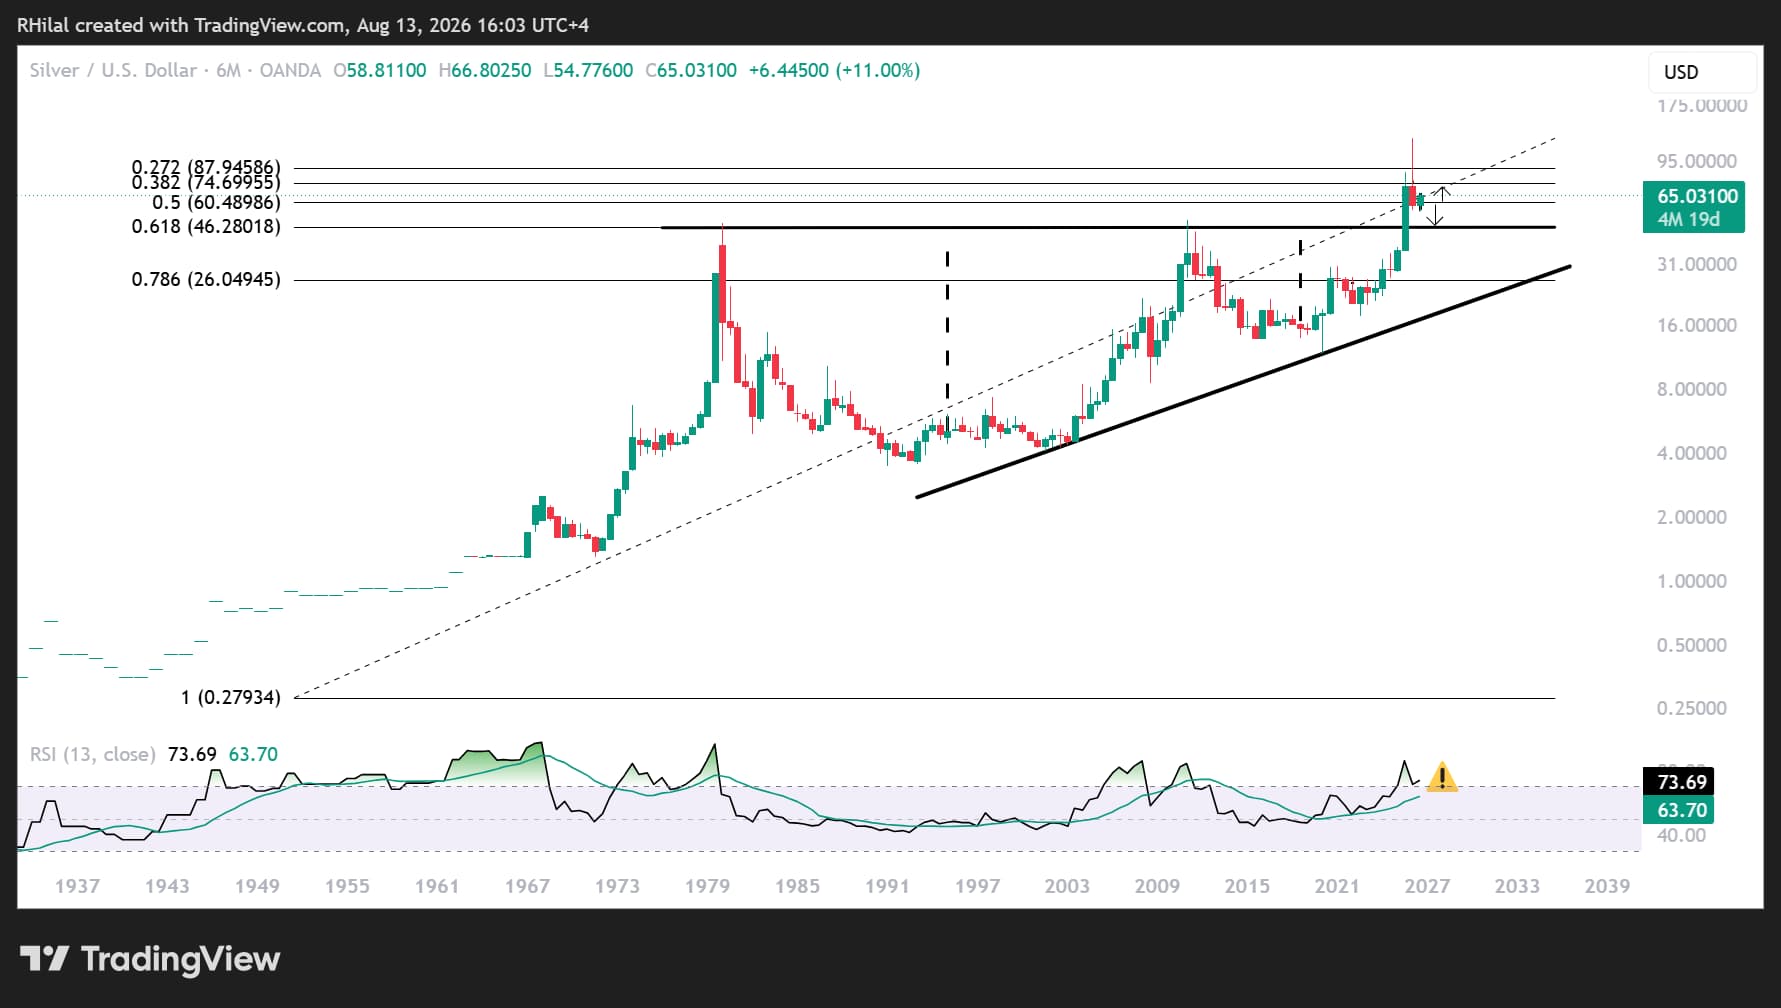
Silver Price Outlook: 6-Month Time Frame – Log Scale
Source: TradingView
Silver's six-month chart highlights several important long-term technical developments following the sharp correction from its 2026 highs.
The broader structure includes:
- A six-month shooting-star reversal candle, reflecting the strong rejection from record territory.
- A hold near the 50% Fibonacci retracement of the secular advance from 1930 to 2026.
- A test of the multi-decade trendline connecting the major highs recorded between 1980 and 2024.
This long-term trendline is particularly important. After acting as structural resistance for decades, it could transition into major support should silver experience another breakdown below $55.
The broader support region between approximately $50 and $46 also aligns with the 61.8% Fibonacci retracement of the longer-term advance.
Should another corrective leg develop this year, this confluence could therefore represent an important long-term area to monitor for stabilization and a potential rebuilding of bullish momentum.
Silver Short-Term Trading Outlook
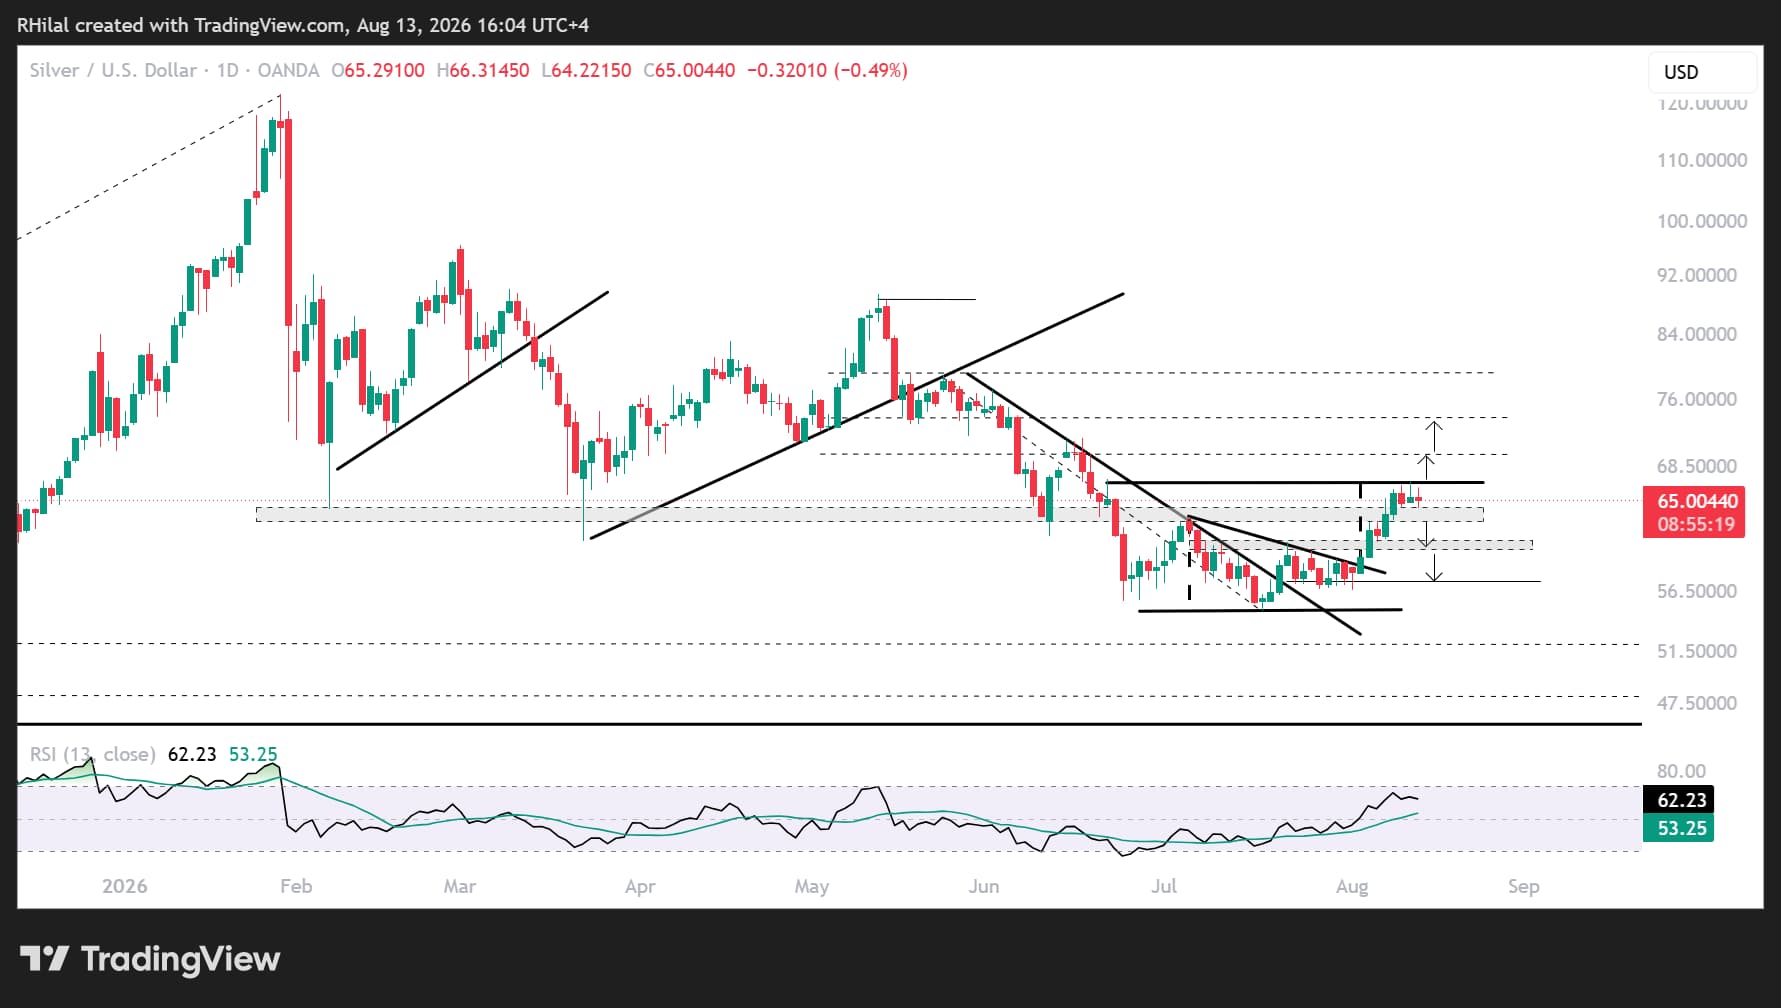
Silver Price Outlook: Daily Time Frame – Log Scale
Source: TradingView
From a daily perspective, silver is consolidating near the projected target of its June-August contracting consolidation breakout around $67.
The level also coincides with the 50% Fibonacci retracement of the May-June decline, increasing its importance as short-term resistance.
At the same time, daily momentum has pushed into overbought territory at levels last seen in May and January 2026, increasing the risk of consolidation or a short-term corrective move.
Silver Bullish Scenario
A sustained breakout above $67 would strengthen the bullish recovery and expose the next Fibonacci resistance levels:
- $70: 61.8% retracement.
- $74: 78.6% retracement.
- $79: 100% retracement.
The $79 region would represent the final major technical test before confidence in a broader long-term bullish continuation strengthens.
Silver Bearish Scenario
On the downside, a break back below the former resistance levels at $64, $61, and $60 would signal a deterioration in short-term momentum and increase the risk of a retest of the 2026 lows near $55.
A sustained breakdown below approximately $55.50 would expose the longer-term $50-$46 support region highlighted on the six-month chart.
Given the significance of this multi-decade technical confluence, the region could become an important area to monitor for stabilization should a deeper silver correction unfold.
US Dollar Index: The Key Intermarket Signal
The US Dollar Index (DXY) remains one of the most important benchmarks for both foreign exchange and precious metals as geopolitical risks and Federal Reserve expectations continue to evolve.
Despite its recent drawdown, DXY remains within the broader uptrend that has defined its 2026 advance.
Two levels remain particularly important:
- 101.80-102.00 resistance: A sustained breakout above this zone would strengthen the bullish dollar outlook and potentially increase downside and volatility risks across major currencies, gold, and silver.
- 99.30 support: A sustained breakdown below this level would weaken the 2026 bullish dollar structure and could provide additional support for currencies and precious metals.
With USD/JPY also approaching the 160 region, the behavior of the dollar around these technical levels could provide important confirmation for the next move across precious metals.
With Fed expectations, geopolitical tensions, energy-market risks, and technical momentum all converging, short-term reversal risks remain elevated even as the longer-term precious-metals recovery remains technically intact.
Written by Razan Hilal, CMT
Follow on X: @Rh_waves