
- Dollar breakout, soaring yields hammer precious metals
- Gold, silver tracking inverse DXY relationship closely
- Silver breakout fails as bearish reversal risks intensify
- Gold testing March uptrend as downside pressure builds
A Toxic Mix for Precious Matals
The combination of a bullish breakout in the US dollar, soaring global bond yields and sizeable losses across Asian equity markets has proven a toxic mix for precious metals on Friday, with gold and silver coming under heavy pressure, reversing gains seen earlier in the week.
What’s changed is the big dollar is finally starting to trade in line with the fundamentals that have been screaming for weeks that it should be stronger. Despite resilient economic activity, strong and broadening inflation and rising Treasury yields, the greenback had continued to soften, creating a strange disconnect between price action and macro reality.
That divergence now appears to be correcting. With rising real yields increasing the opportunity cost of holding non-yielding assets, it’s proving a brutal combination for precious metals.
Source: TradingView
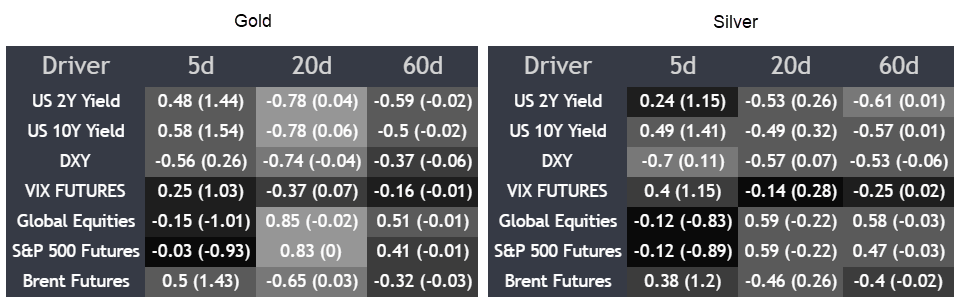
As seen in the correlation coefficient matrix above, the most consistent relationship both gold and silver have shown in recent weeks has been with the US dollar.
Gold’s rolling 5, 20 and 60-day correlations with DXY sit at -0.56, -0.74 and -0.37 respectively, while silver’s are even stronger at -0.70, -0.57 and -0.53, reinforcing just how closely both have tracked the greenback over that period.
While silver has been off on its own tangent at times this week, both metals have also demonstrated a reasonably strong relationship with the performance of riskier asset classes recently, particularly equities. That makes the current environment an ugly one for the precious metals complex.
Gold Technical Outlook
Source: TradingView
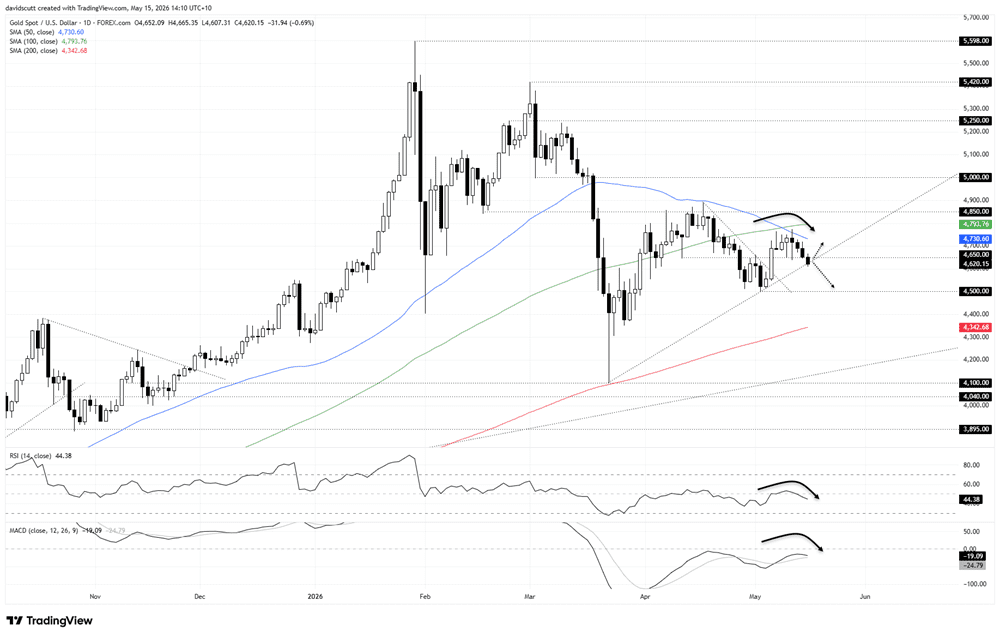
Gold has looked sluggish relative to silver’s price action this week, unable to sustain a push above the 50-day moving average before embarking on a slow grinding move lower in recent days, seeing the price lose $4650 support before eventually stalling at the uptrend drawn from the March low.
Depending on what happens at this level, it may either be confirmed as uptrend support or evidence that the unconvincing corrective bounce from the March lows is at risk of breaking down.
Both RSI (14) and MACD are generating mildly bearish signals, marginally favouring downside over upside, but the overall message is anything but definitive when it comes to directional risks.
If the price trades beneath the March uptrend, shorts could be established with a tight stop above it or $4650 for protection, targeting $4500 initially. If the price holds the uptrend, confirming it as support, longs could be established targeting $4650 initially and, beyond that, the 50-day moving average.
I’ve chosen to use daily charts to show where the key moving averages sit, but some traders may prefer to use charts with a shorter tick to get a cleaner sense of where the price sits within the levels discussed.
Silver Technical Outlook
Source: TradingView
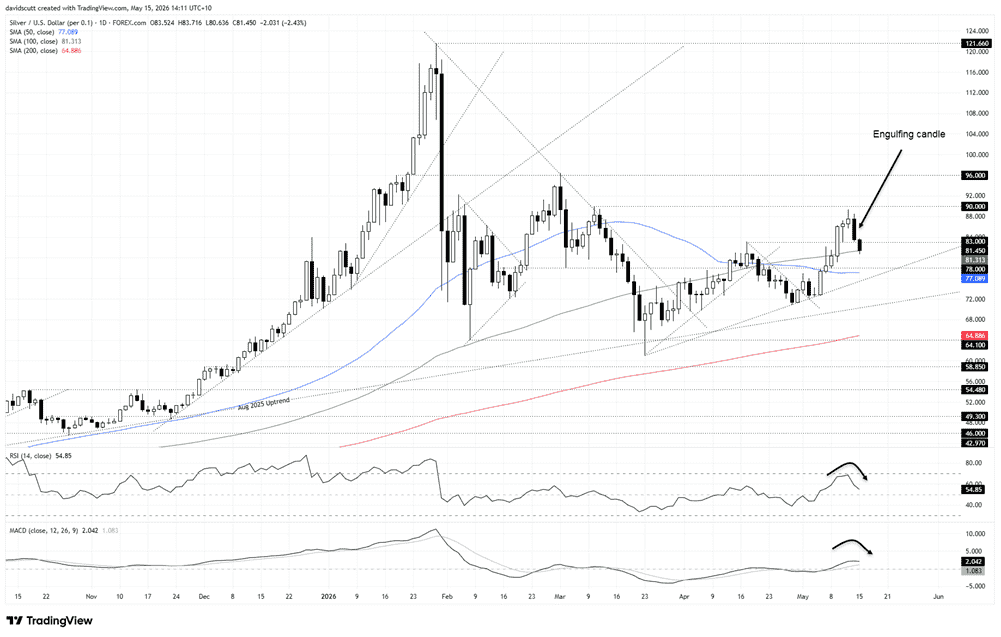
Having broken out from $83 resistance earlier this week, silver came within a whisker of testing the March 10 swing high of $90 before faltering, ultimately delivering a bearish engulfing candle on Thursday that warned of renewed downside risks.
Those have materialised in Asian trade on Friday with the price slicing back beneath the breakout level at $83 before stalling around the 100-day moving average, an important level the price has respected frequently in recent months. It now becomes the focal point, allowing trades to be set around it depending on how the near-term price action evolves.
With RSI (14) rolling over and MACD converging with the signal line while holding in positive territory, momentum looks to be shifting but not yet decisively in favour of the bears. As such, I’m keeping an open mind on two-way setups, although downside is preferred overall.
If the price pushes beneath the 100-day moving average and holds there, shorts could be established with a tight stop above for protection, initially targeting $78 support. If bids at the 100DMA continue to absorb offers, the alternate option is to establish longs with a tight stop beneath the average, targeting a retest of $83.