


Gold Rally Continues to Run
Last week bought a brief pullback but it didn’t last for long as buyers pounced on the $4550 level to run up to yet another fresh all-time-high. While silver stole the headlines into the 2026 open, the rally in gold has remained consistent and powerful with bulls forcing fresh higher-highs.
But there have been pullbacks, albeit short-lived. Last week saw the $4550 test and the week before that we had the falling wedge build with support holding at prior resistance, around the $4402 level.
The bullish bias has continued with force and that’s been the same case for almost two years now, ever since gold put in its last test below the $2k/oz level in February of 2024 and embarking on a bullish run that remains in effect today.
Gold Weekly Price Chart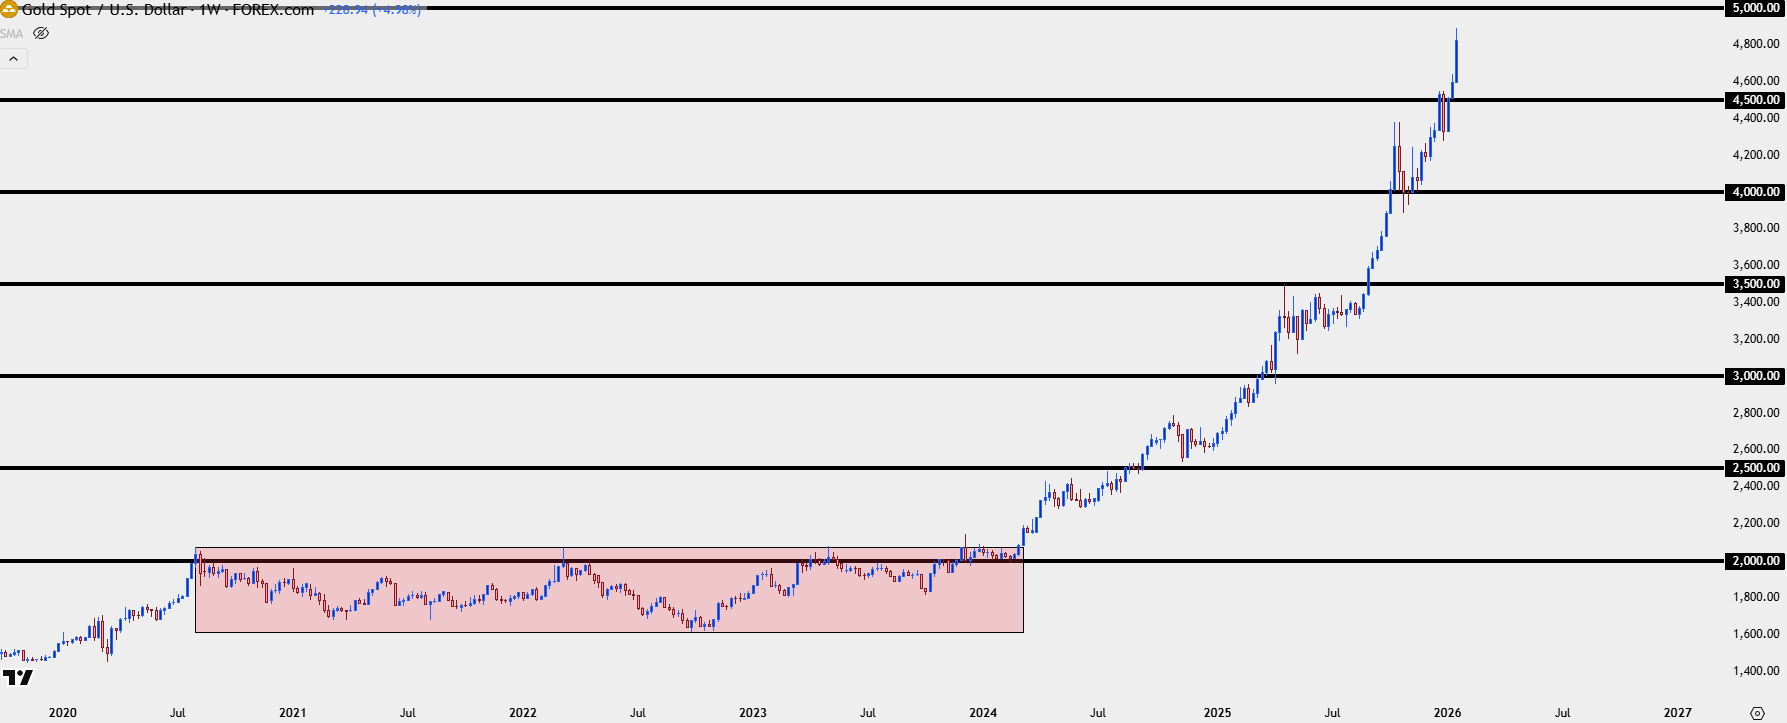
Chart prepared by James Stanley; data derived from Tradingview
On the above chart I’ve noted a series of major psychological levels and there’s been a tendency during this run for inflection points to develop around those prices. The $3500 level is of particular note as this came into play last April and held the highs for about four months until bulls were ultimately able to break out. The $4k level was a notable spot of support just a couple months ago, and even $4500 slowed the rally albeit for a short time.

The reason this is important is because the metal is already stretched and that first test of $5k can bring profit taking in the move. And like we saw in 2024, even the anticipation of that level coming into play could coerce bulls to take some profit off-the-table. This doesn’t mean that the rally is over, but it does further highlight the danger of chasing and, instead, the possible value of being patient and looking for support so that, at the least, a more strategic entry can be afforded.
The current short-term rally in gold has been intense as President Trump ramped up tariff concerns over the weekend, which is what helped the rally to build from last week’s $4550 support test. But there’s context for support at a prior spot of resistance, taken from around $4630. So far, bulls have shied away from a $4900 re-test and this is similar to what showed in Q4 of 2024 when buyers stalled at $2790 about a week ahead of the US Presidential Election.
Gold Daily Price Chart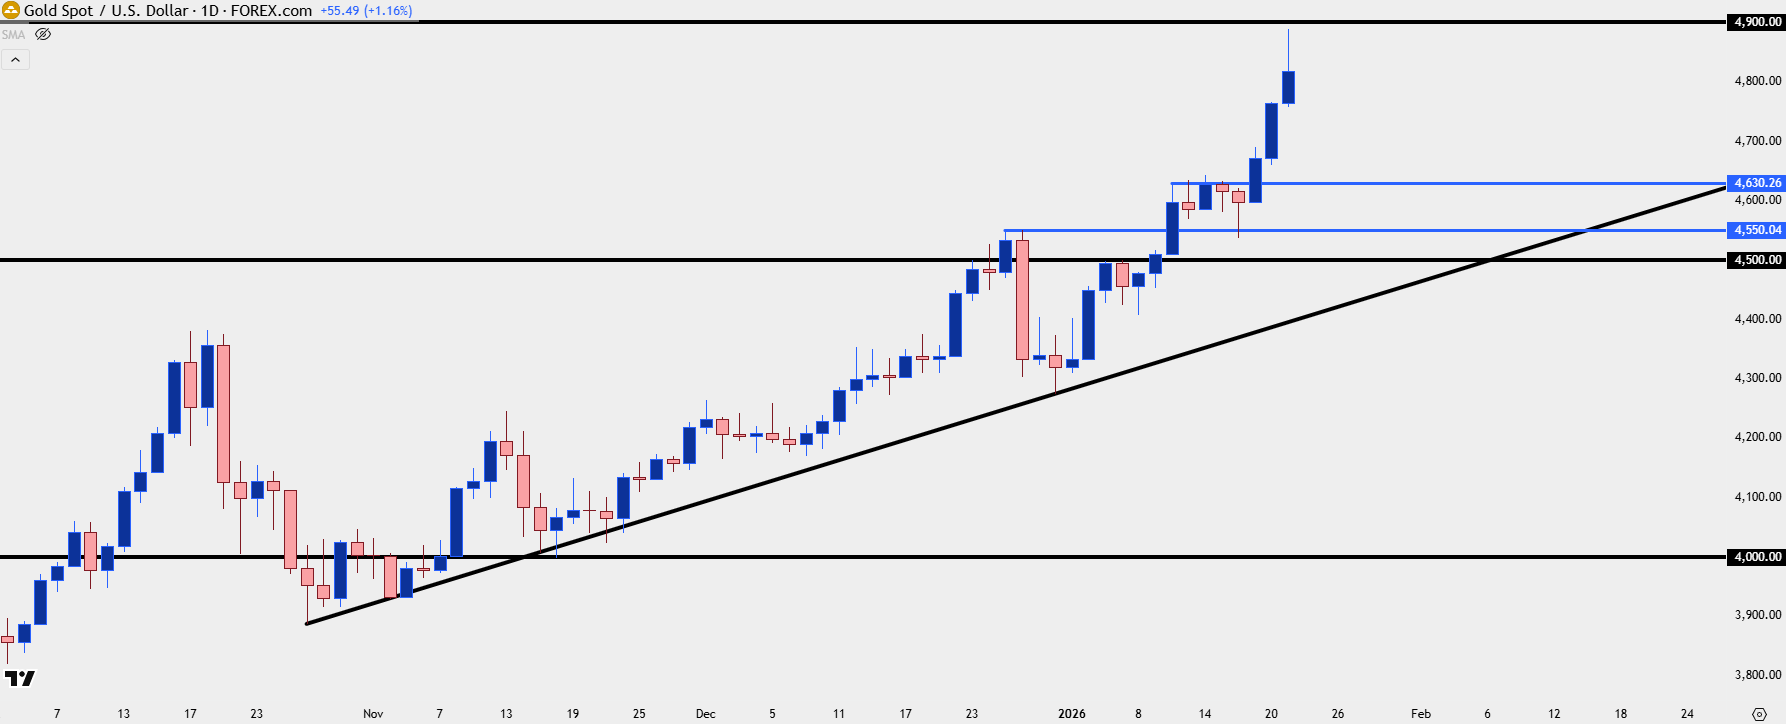
Chart prepared by James Stanley; data derived from Tradingview
Going even shorter-term, there’s one more level of note and that’s a prior resistance swing of $4690. This initially held the high after the Sunday open and bulls soon forced the rally beyond that price, but so far it hasn’t yet been tested for support and for buyers, a hold of pullbacks at that level might actually be a more ideal arrangement.
As we can see from the three-day-rally there’s been only minimal slowing on the way up and that’s the type of excitement buyers pushing continuation strategies are going to want to see; and to that similar effect, on pullbacks, the bullish anticipation that leads into the scenario where buyers show up ahead of a test of $4630 would present a more-bullish case. Given how entrenched the run has become a wider pullback is certainly possible which is why $4630 and $4550 and even $4500 are still of note.
Gold Four-Hour Price Chart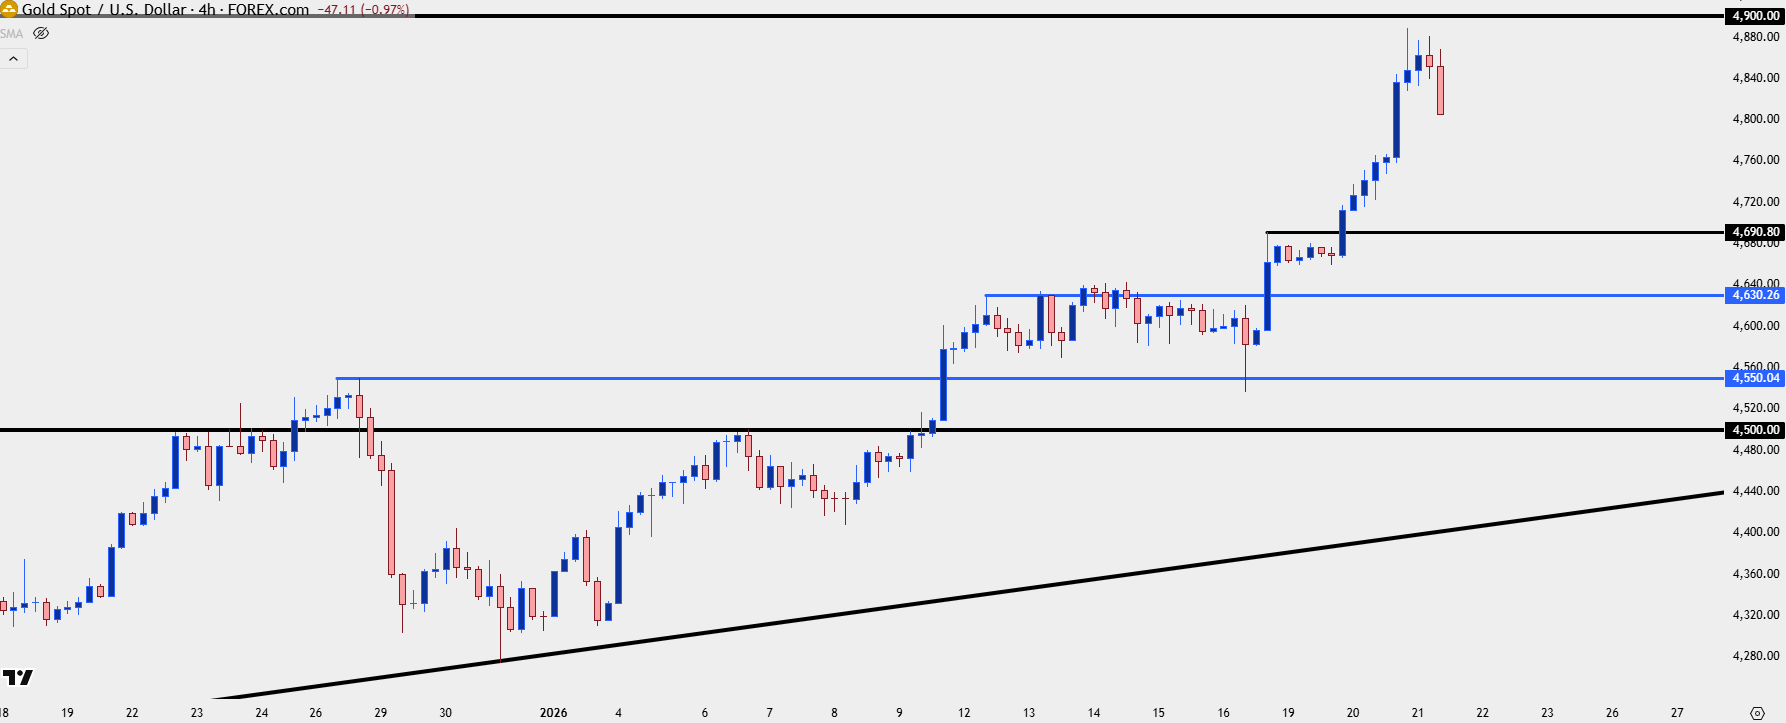
Chart prepared by James Stanley; data derived from Tradingview
--- written by James Stanley, Senior Market Analyst, Global Macro




