


DXY strength is weighing on metals and major currency pairs as escalating Middle East energy disruptions lift Brent crude prices toward $100 again. The IEA’s strategic reserve release may not be sufficient to offset supply disruptions, prompting some of the region’s largest oil producers to halt or reduce operations.
Latest Oil Disruptions in the Middle East
- Shipping and tanker attacks near Iraq
- Drone strikes on Oman’s ports
- The continued closure of the Strait of Hormuz
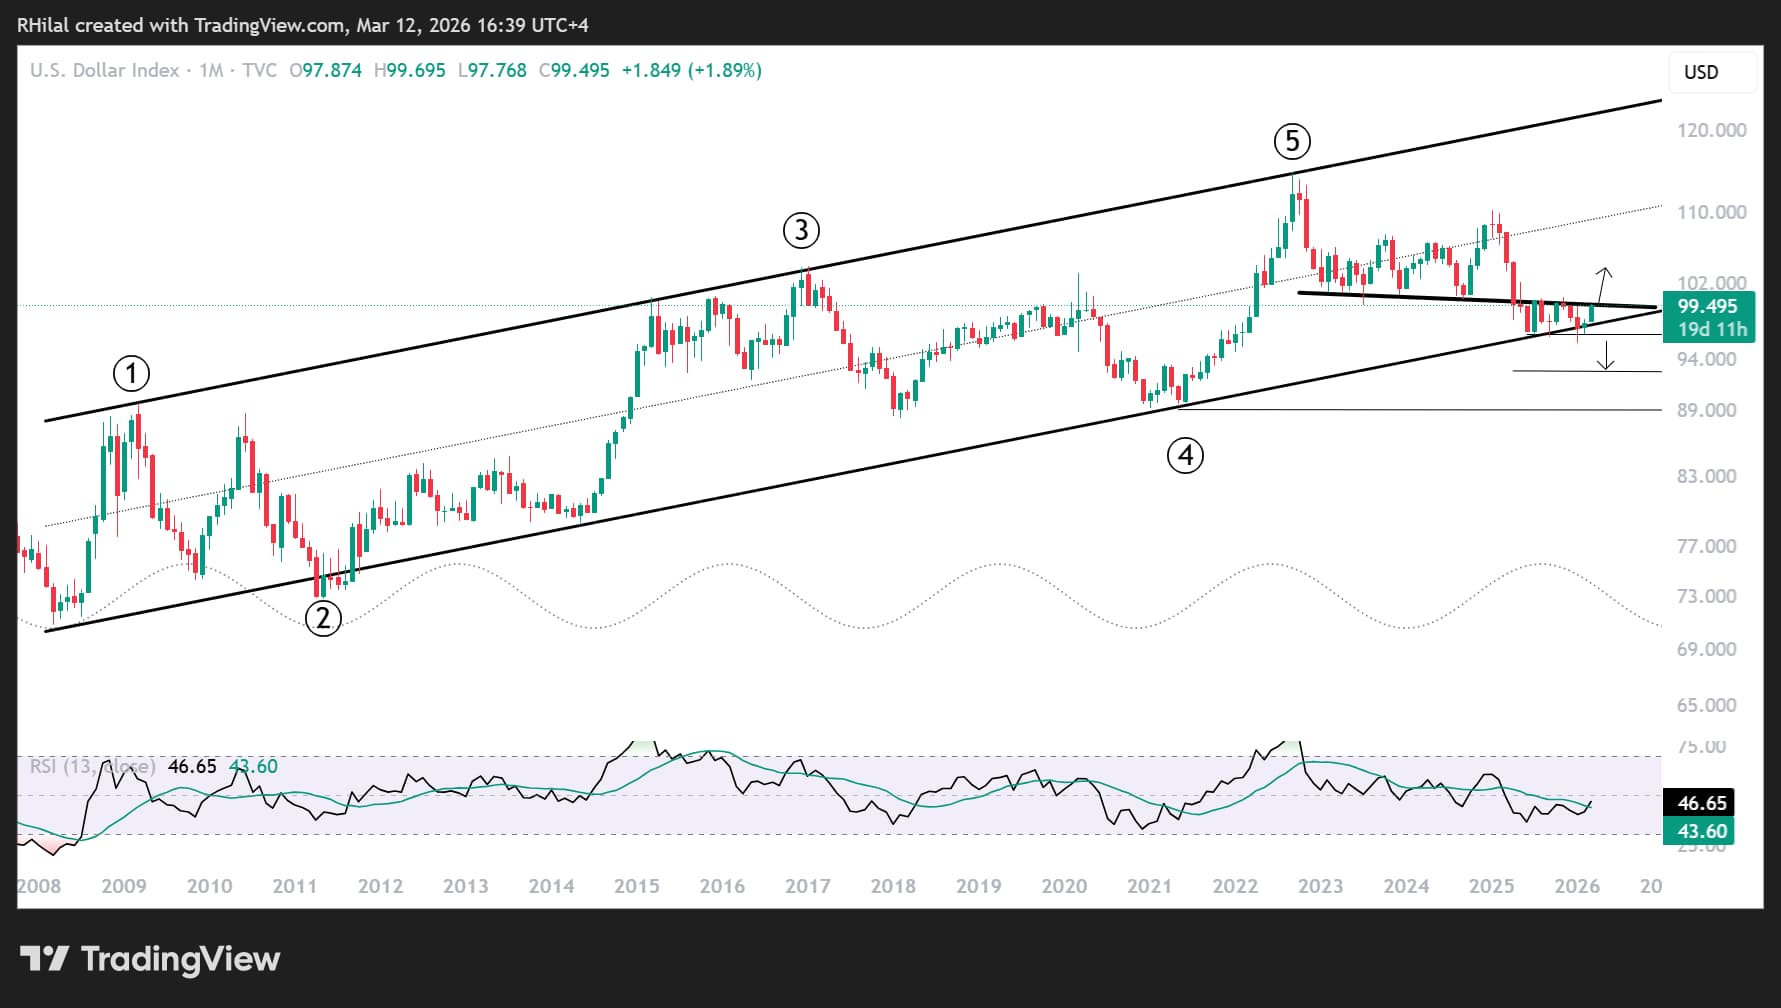
With supply risks persisting, inflation concerns remain elevated alongside crude prices, lifting the US Dollar Index (DXY) toward key resistance levels at 99.50 and 100.40.
Technical Levels to Watch
DXY Price Outlook: Monthly Time Frame – Log Scale
Source: Trading view
The current resistance zone on the DXY, connecting price action between January 2023 and March 2026, is critical in confirming bullish continuation from the broader uptrend originating at the 2008 lows.
A sustained breakout could reinforce dollar strength across major currency pairs, while failure to break above this zone could trigger short-term consolidation or a corrective pullback.
USDJPY Price Outlook: Weekly Time Frame – Log Scale
Source: Trading view
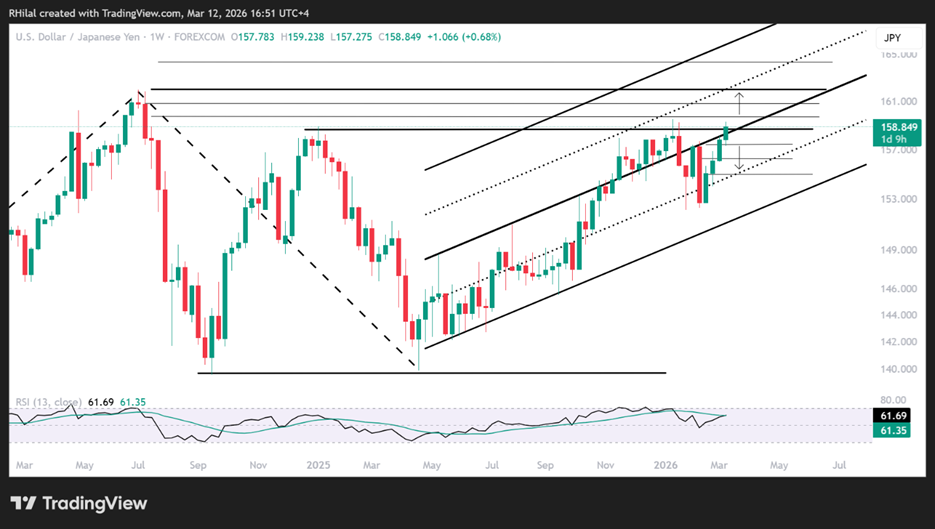
In line with the DXY’s bullish hold near 99.50, USDJPY remains capped below the 159.60 resistance level, which aligns with the 2025 highs.
Bullish Scenario
A weekly close above 159.60 would expose further upside targets, projected using the Fibonacci extension tool between the April 2025 low, January 2026 high, and February 2026 low:
- 159.60: 38.2%
- 160.80: 44%
- 162.00 (near the 2024 highs): 50%
Such a move could also revive speculation around potential Bank of Japan (BoJ) intervention.
Bearish Scenario
On the downside, a close below 157.40, 156.20, and 154.80 would reassert bearish bias on the chart. These downside levels are derived from the Fibonacci retracement tool applied between the February 2026 low and the March 2026 high.
Gold Price Outlook: Daily Time Frame – Log Scale
Source: Trading view
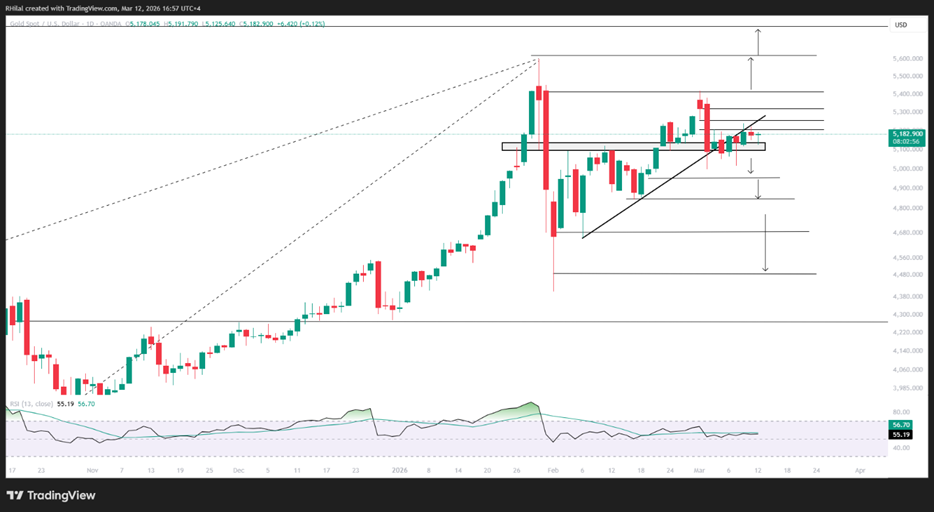
In line with the dollar’s bullish hold and consolidation near 99.50, Gold remains in consolidation below 5200, trading beyond the trendline connecting higher lows since February 2026. The bias leans neutral-to-bearish below the 5,200 resistance and above the 4,960-support.
Bullish Scenario: A weekly close above 5,200 exposes: 5,250 - 5,320 - 5,400 - 5,600 - 6,000
On the downside, a close below 4,960 exposes a deeper correction toward: 4,840 - 4,680 - 4,480
These represent approximately 200-point declines between previously respected support zones. A decisive break below the February 2026 lows could trigger an extended correction of approximately 1,000 points, potentially resetting momentum before gold realigns with longer-term bullish prospects and new record highs.
Written by Razan Hilal, CMT
Follow on X: @Rh_waves




