Japanese Yen Talking Points:
- It’s been a strong start to Q3 for USD/JPY, with the pair rallying from a higher-low set on the first day of Q3 trade.
- EUR/JPY has jumped above the 170.00 handle and GBP/JPY has come within 20 pips of a test at the 200-level. In the video, I go over strategy for each pair.
- I look into all three of these pairs in each weekly webinar, and you’re welcome to join the next one. Click here to register.
USD/JPY has put in a strong push so far in Q3 and while it’s still early, the rally of higher-highs and lows over the past week and change has been rather consistent. I looked into this in the Tuesday webinar and I highlighted a level of note at 145.92, which remains in-play as of this writing. It’s currently helping to hold support, and from a shorter-term basis, continued defense can keep the door open for a push of bullish continuation.
Bigger picture, it’s the 145.00 level that stands out a bit more as this was a big spot of support-turned-resistance in Q2 trade and since the breakout earlier this week, there hasn’t yet been a show of support there after it held as resistance and an initial higher-high last week.
USD/JPY Four-Hour Chart

Chart prepared by James Stanley; data derived from Tradingview
USD/JPY
The daily chart of USD/JPY both accentuates the importance of that 145.00 level while also highlighting the next significant spot of resistance, plotted around the 148.00 handle. That’s ultimately the next major spot for bulls to contend with, if they can keep the recent streak alive; but, for now, that’s a key resistance target for bullish continuation scenarios.
USD/JPY Daily Price Chart
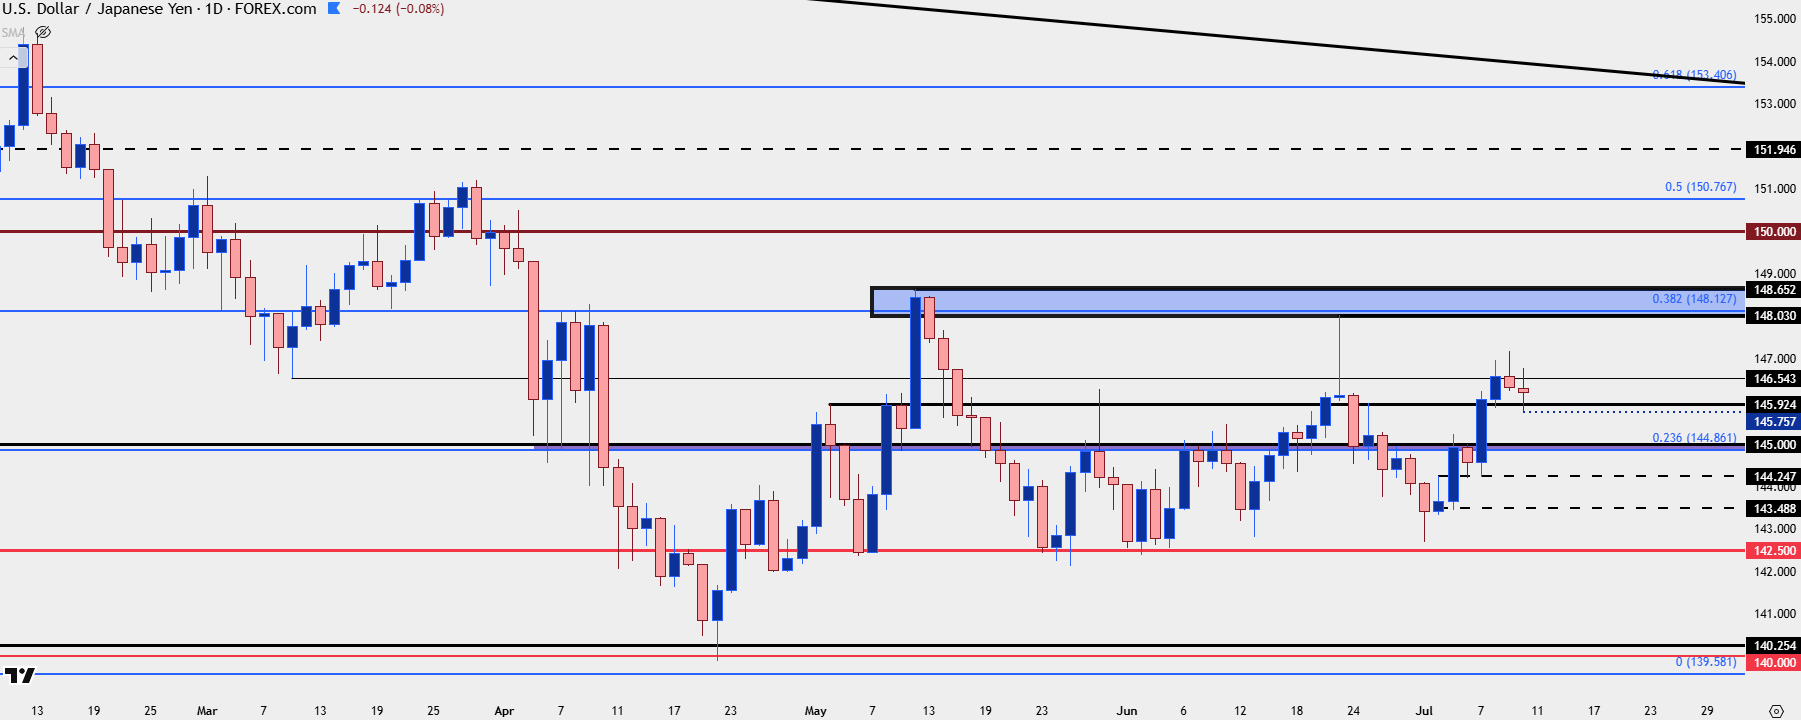
Chart prepared by James Stanley; data derived from Tradingview
EUR/JPY 170.00
EUR/JPY has pushed above the psychological level of 170.00 and notably, this was a spot that bulls could not test above back in 2007 and 2008. Price was finally able to test above the big figure last year, helped along by the Yen-breakdown theme in April; but that was relatively short-lived as prices pushed back down in July and, until last week, hadn’t yet tested above.
That now becomes a major focal point for pullbacks and support tests. Notably, RSI on the daily chart has just crossed below the 70-level.
EUR/JPY Daily Price Chart
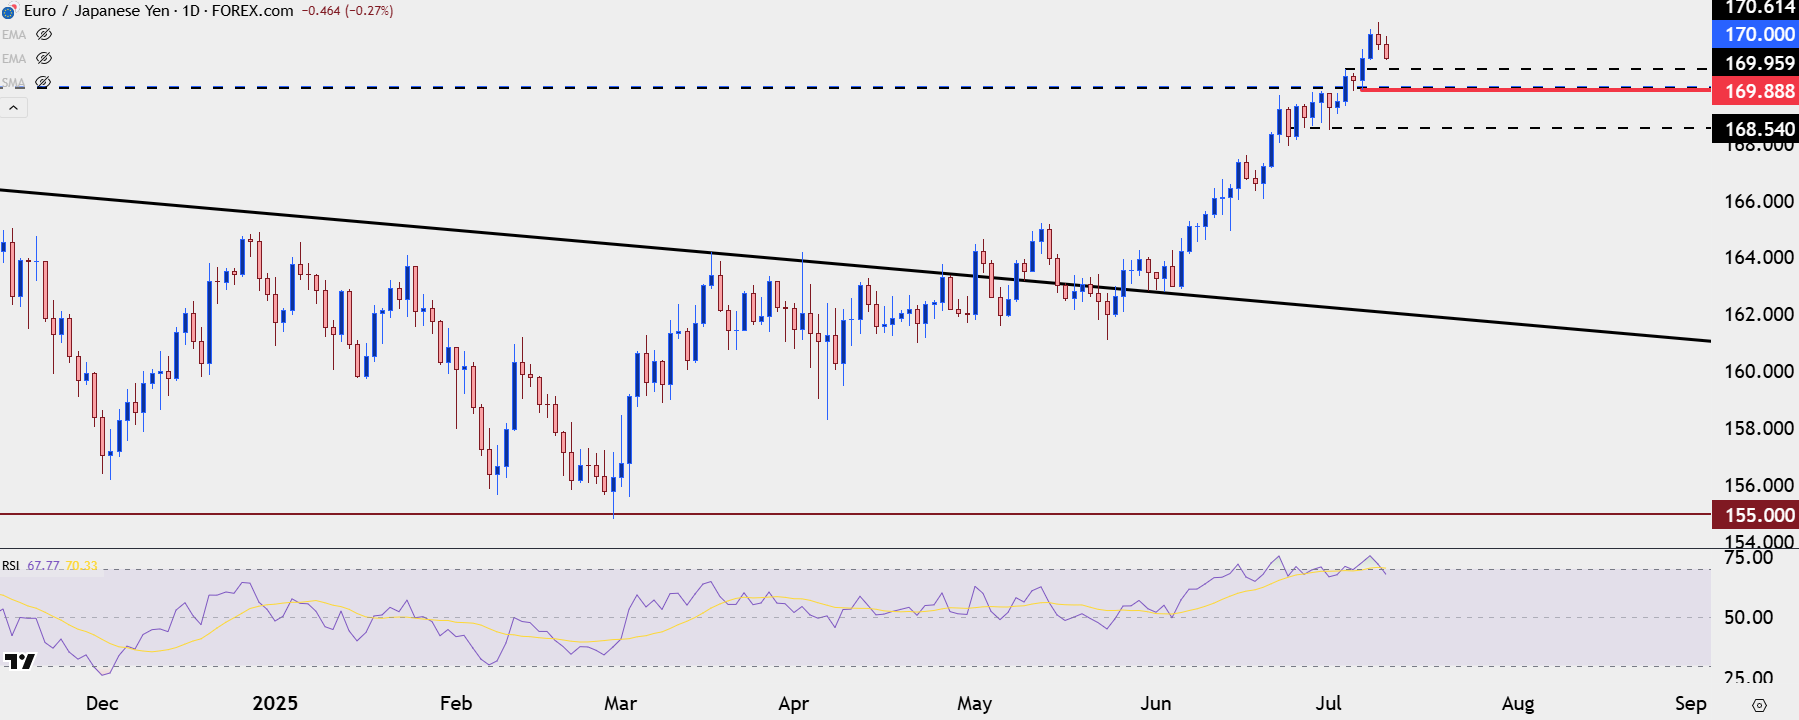
Chart prepared by James Stanley; data derived from Tradingview
GBP/JPY
GBP/JPY pulled back to test a trendline last week and as Yen-weakness came back in both USD/JPY and EUR/JPY, GBP/JPY jumped with a fast push towards the psychological level at 200.00. The pair stalled about 20 pips shy of the big figure, and it’s so far pulled back for a support test at a prior spot of resistance at 198.50.
As looked at in the video, there’s deeper support potential at 198.08, after which zones come back in the picture at 197.71-197.82 and then 197.06-197.22.
GBP/JPY Four-Hour Chart
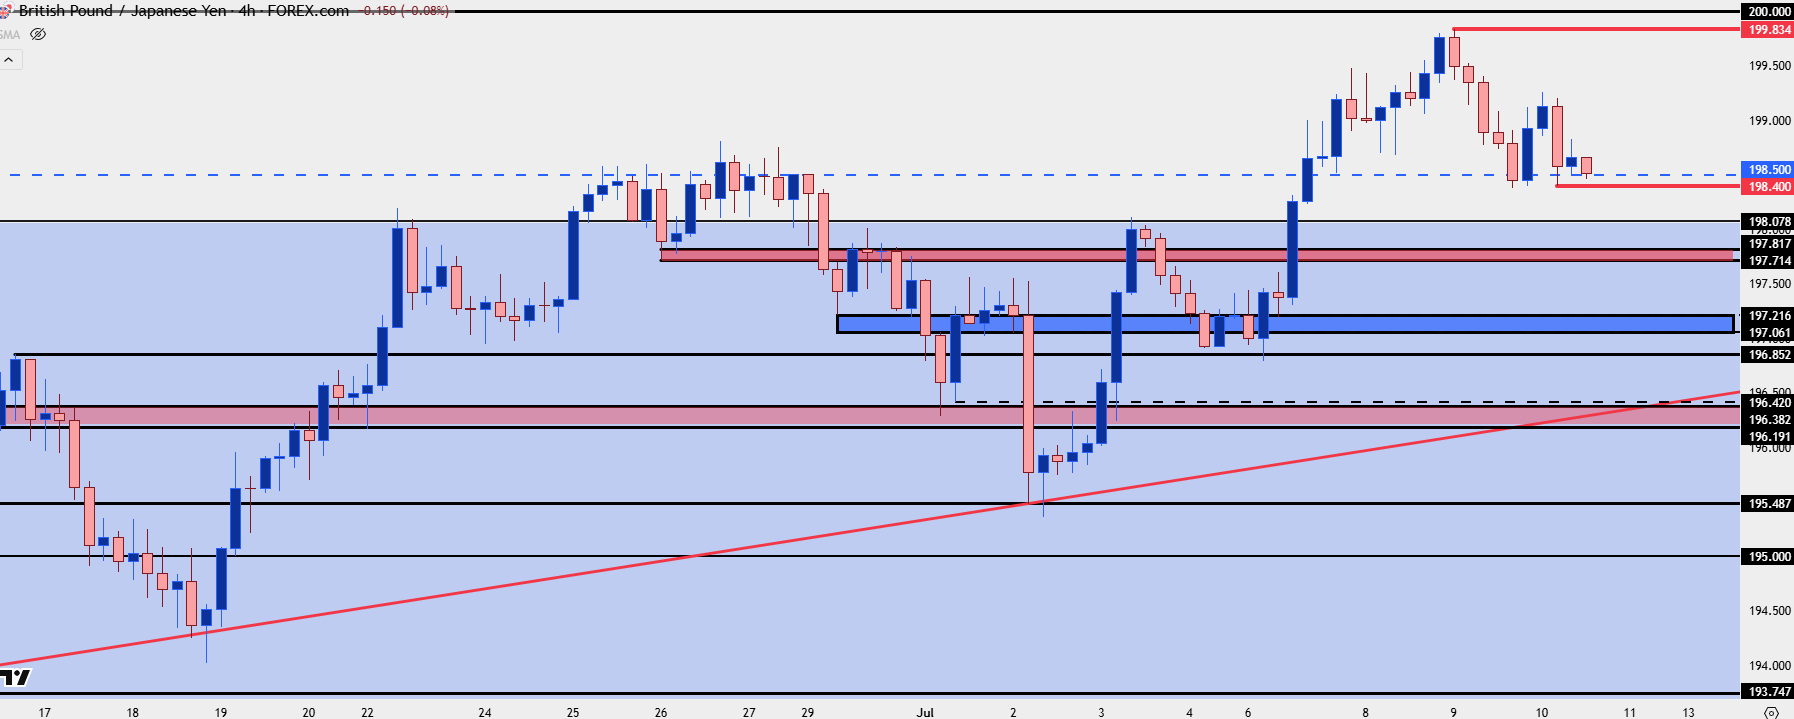
Chart prepared by James Stanley; data derived from Tradingview
--- written by James Stanley, Senior Strategist