mizuho financial facing further potential medium term downside pressure 2685782017
Yesterday, 31 January 2017, Mizuho Financial (TSE: 8411) has released its latest Q3 2017 earnings results on a group level basis where key performance variables […]

Yesterday, 31 January 2017, Mizuho Financial (TSE: 8411) has released its latest Q3 2017 earnings results on a group level basis where key performance variables […]

Yesterday, 31 January 2017, Mizuho Financial (TSE: 8411) has released its latest Q3 2017 earnings results on a group level basis where key performance variables have managed to beat consensus;
Despite its better than expected earnings results, Mizhuo Financial has continued to slide and recorded another loss of -0.76% in today, 01 February 2017 (Japanese cash session). The positive effects from Bank of Japan’s yield curve control monetary policy (BOJ has pledged to keep the benchmark 10-year JGB yield at 0%) and post U.S. Presidential election rally where the hyped up expectations on President Trump’s administration to remove or reduce current financial regulations imposed by the Dodd-Frank Act have started wane off.
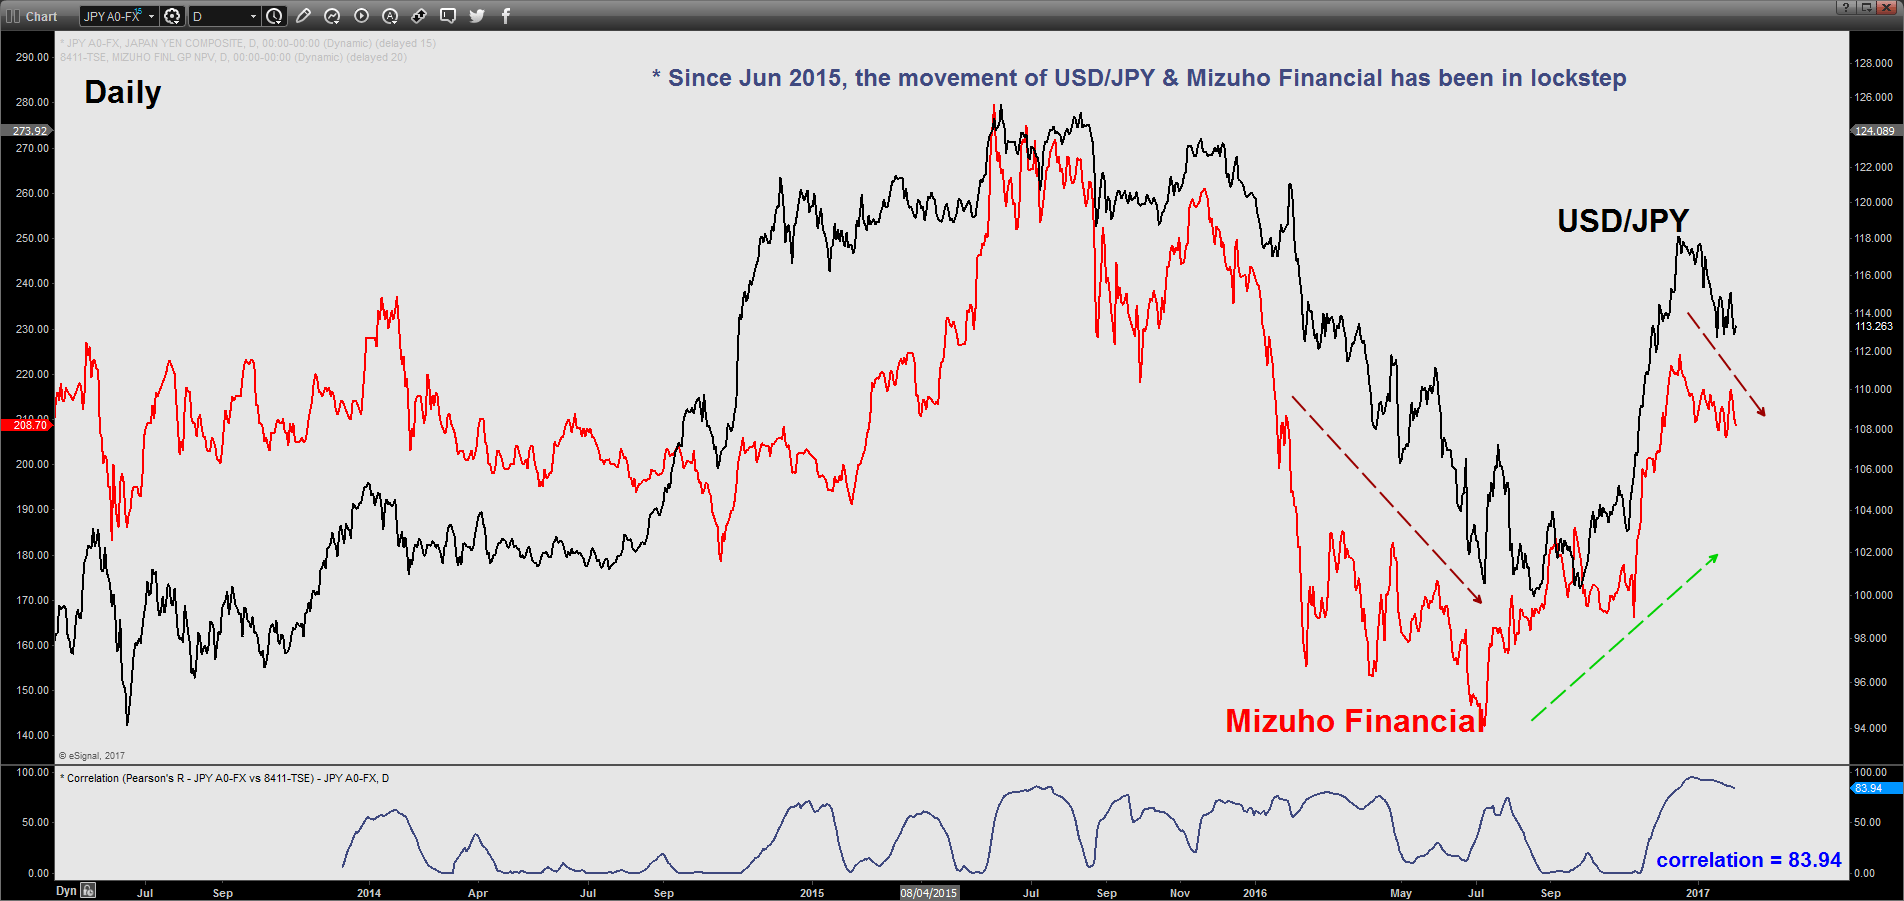
The current movement of Mizuho Financial is now more dependent on the USD/JPY as seen from the second chart below where it has a high correlation reading of 83.94. This is likely to be the potential risk aversion factor at play in the markets on the moment (protectionist policies favoured by President Trump without much clarity on fiscal policies such as tax cuts). A further decline in the USD/JPY (JPY’s strength revival) can hurt Japanese exporter’s profit margins which translate to lower loan growth for Japanese banks and even an increase in provision for bad loans.
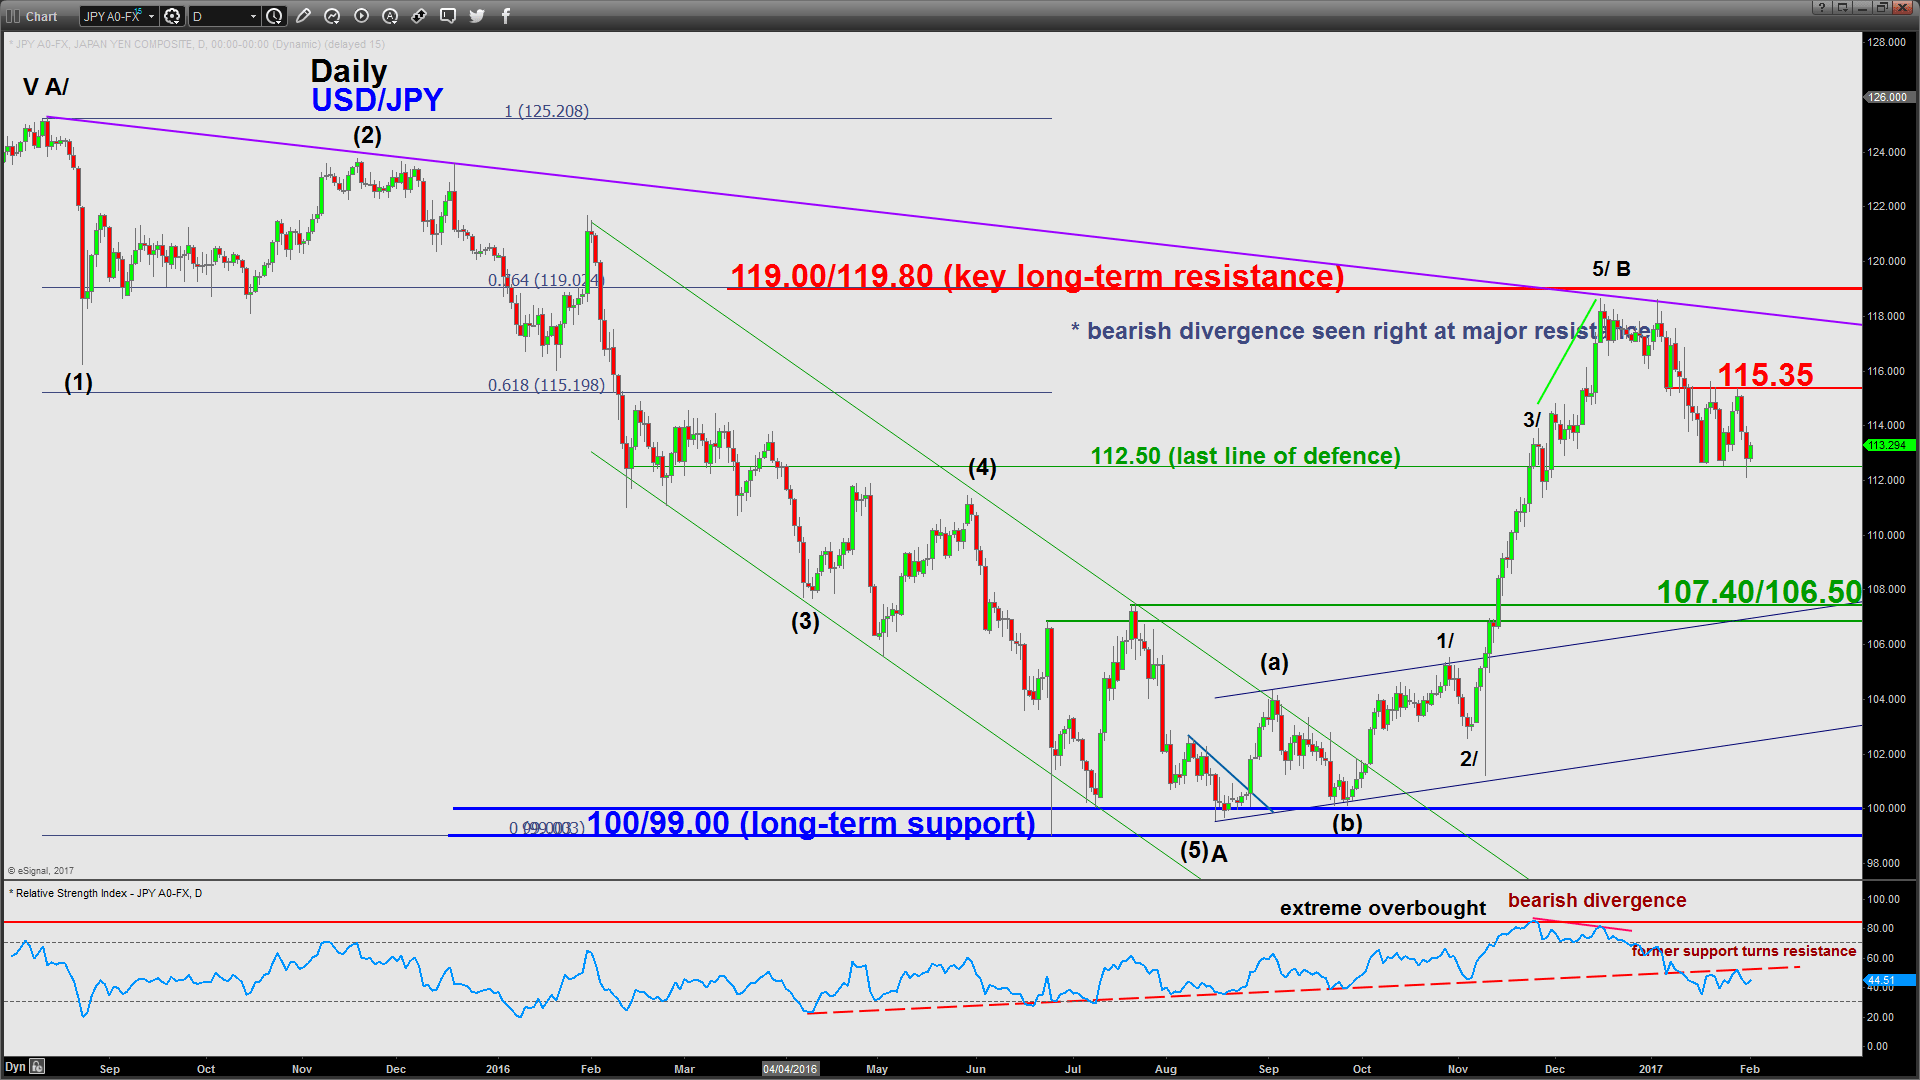
From a technical analysis perspective (see 3rd chart), the USD/JPY may have already seen its major top/resistance at 118.66 (close to the 120 psychological level) and the “last line of defence” is likely the range support formed last week at 112.50 where it tested and survived in yesterday’s U.S. session. A daily close below 112.50 is likely to open up scope for a deeper decline towards the next support at 107.40/106.50 from a multi-month (1 to 3 months) horizon. If this bearish scenario for USD/JPY pans out, it will be detrimental for Mizuho Financial.
Let us now focus on the technical elements of Mizuho Financial
 (Click to enlarge charts)
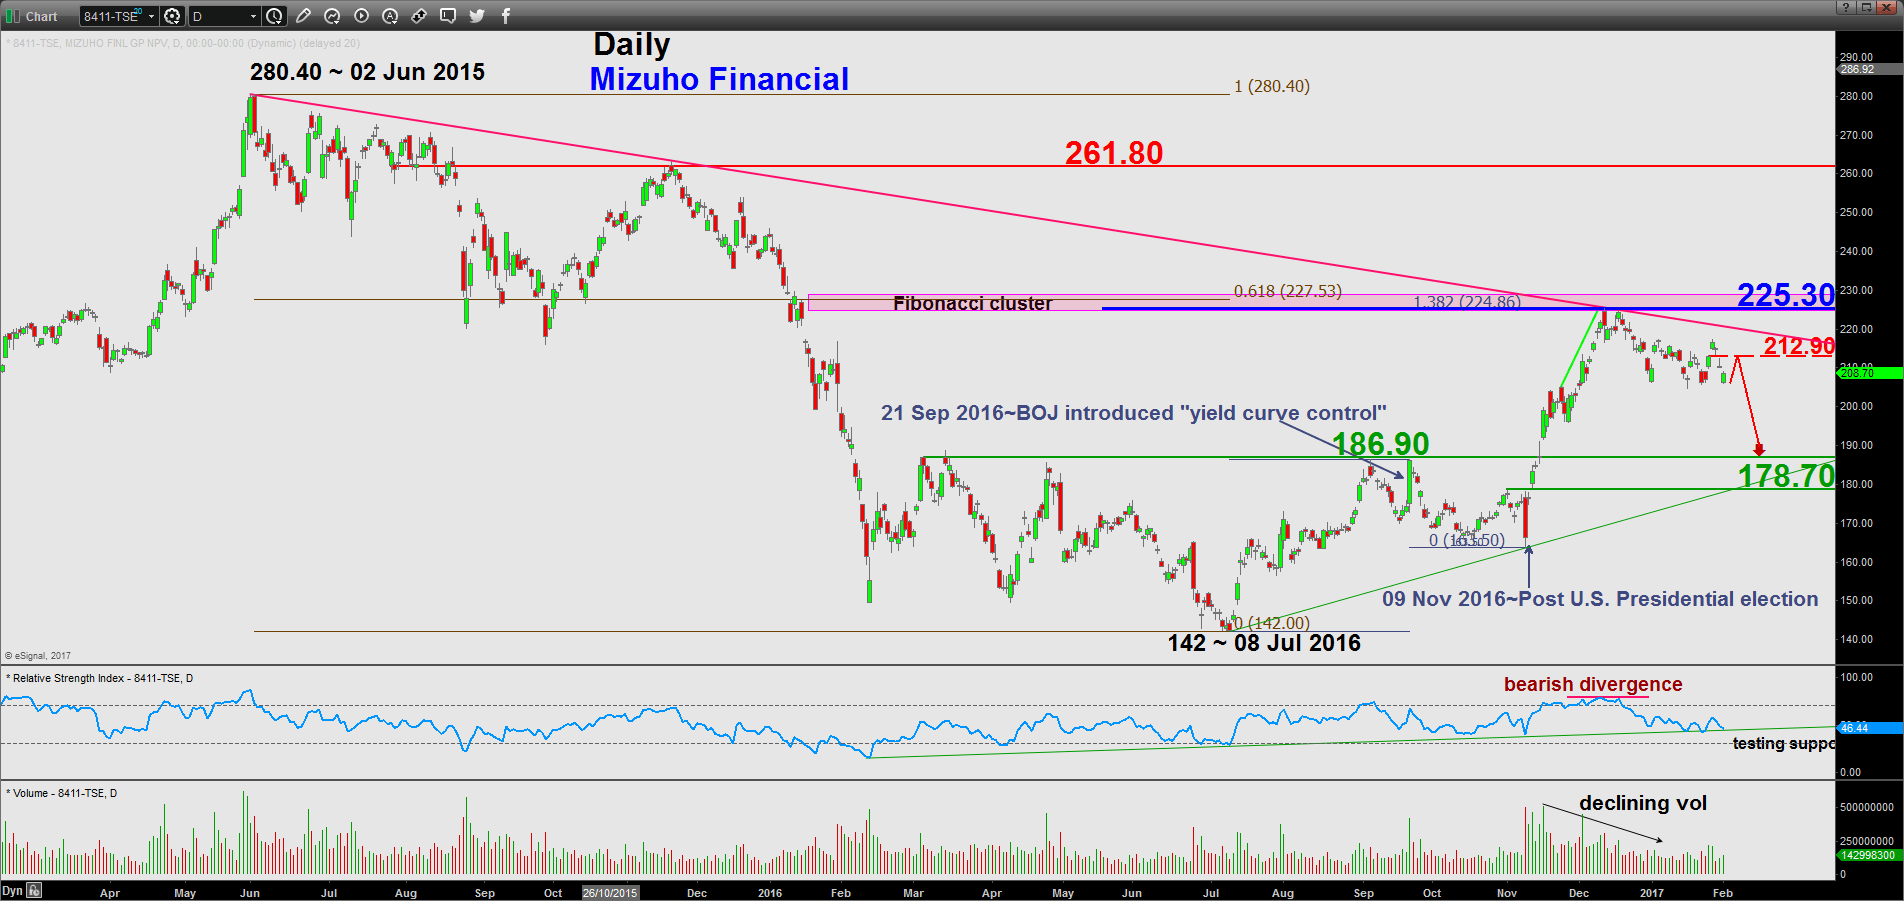
Intermediate resistance: 212.90
Pivot (key resistance): 225.30
Supports: 186.90 & 178.70
Next support: 261.80
As long as the 225.30 pivotal resistance is not surpassed, Mizuho Financial may see face further downside pressure towards the next support at 186.90 and even 178.70 next.
However, a clearance above 225.30 is likely to invalidate the bearish scenario to see a continuation of the multi-month up move towards the next resistance at 261.80.
Charts are from eSignal
Disclaimer
The material provided herein is general in nature and does not take into account your objectives, financial situation or needs. While every care has been taken in preparing this material, we do not provide any representation or warranty (express or implied) with respect to its completeness or accuracy. This is not an invitation or an offer to invest nor is it a recommendation to buy or sell investments. City Index recommends you to seek independent financial and legal advice before making any financial investment decision. Trading CFDs and FX on margin carries a higher level of risk, and may not be suitable for all investors. The possibility exists that you could lose more than your initial investment further CFD investors do not own or have any rights to the underlying assets. It is important you consider our Financial Services Guide and Product Disclosure Statement (PDS) available at www.cityindex.com.au, before deciding to acquire or hold our products. As a part of our market risk management, we may take the opposite side of your trade. GAIN Capital Australia Pty Ltd (ACN 141 774 727, AFSL 345646) is the CFD issuer and our products are traded off exchange.