


Nasdaq 100, S&P 500, Dow Jones Outlook: Has The Dead Cat Bounced?
Wall Street’s record highs quickly reversed as Trump’s revived trade war triggered the worst sell-off in six months — are we seeing a dead cat bounce?
Share this:

The revival of Trump’s trade war shook sentiment on Friday, resulting in the worst day for Wall Street indices in six months. The S&P 500, Nasdaq 100, and Dow Jones all fell sharply just a day after reaching fresh record highs.
In typical shell-shocked fashion, Wall Street indices have since entered choppy trading conditions within the lower half of Friday’s sell-off, though prices have been drifting higher in a corrective manner. Specifically, markets appear to be in the midst of a dead cat bounce, and with momentum turning lower once more, I’m now on guard for another leg down.
View related analysis:
View related analysis:
Wall Street Indices: Are Rebounds Just Dead Cats Bouncing?
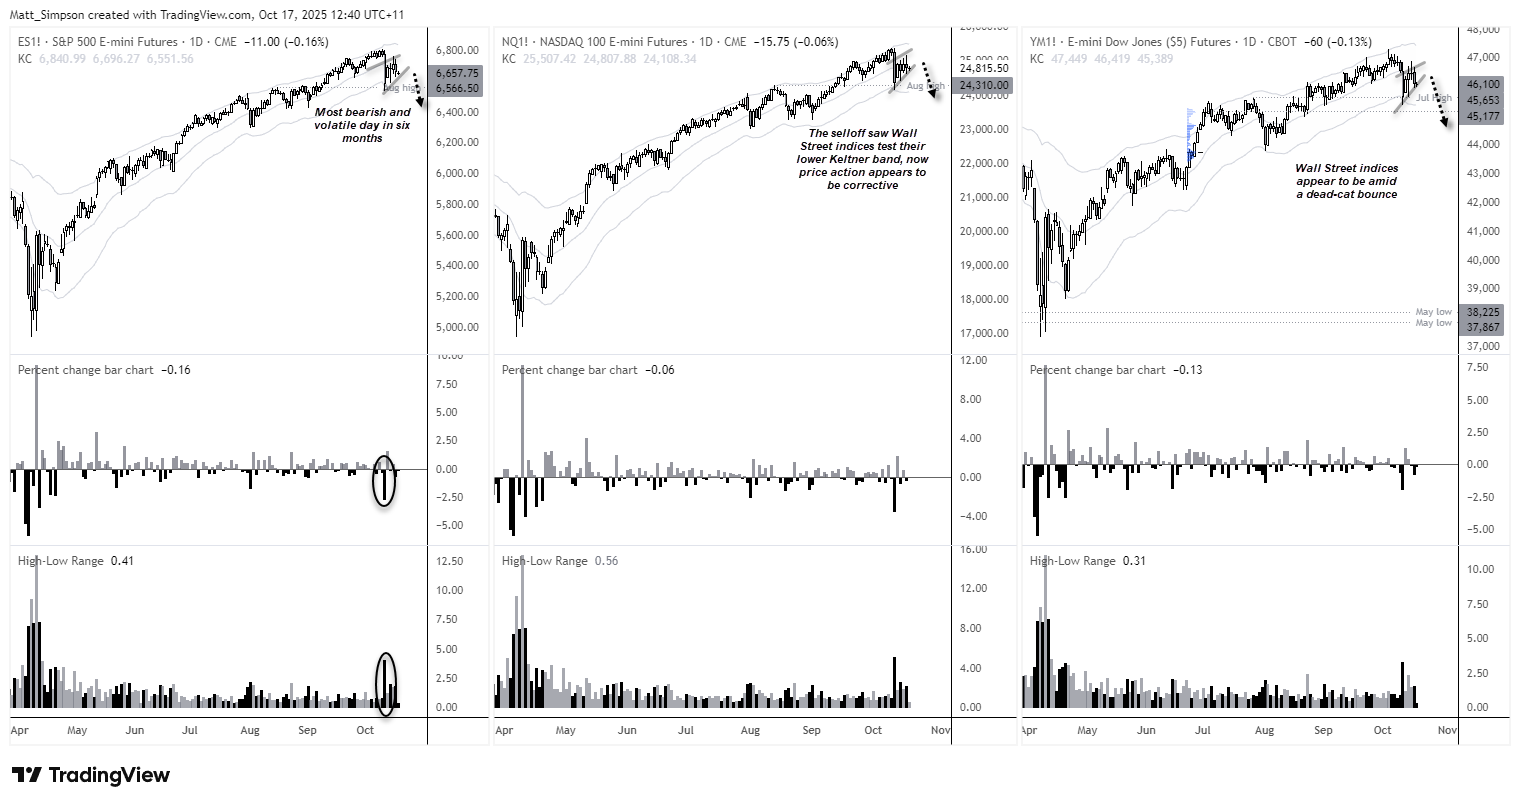
Chart analysis by Matt Simpson, Source: TradingView, CME, CBOT
A dead cat bounce is a short-lived rebound in prices during a broader downtrend. It occurs when a heavily sold market — such as a stock index, currency, or commodity — briefly rallies before resuming its decline. The move is typically driven by short covering, bargain hunting, or temporary optimism rather than a genuine shift in fundamentals or sentiment.


Nasdaq 100 Futures (NQ1!) Technical Analysis
The daily chart shows the Nasdaq correction has entered its fourth day, with prices gapping lower beneath the 20-day EMA. A bearish doji formed on Thursday, signalling waning bullish momentum, while a bearish RSI(14) divergence appeared ahead of last Friday’s sell-off.
The 1-hour chart shows a swing high beneath a weekly VPOC (25,218), with prices now trading below the 200-bar EMA and high-volume node (HVN) of the four-day correction. Bears could look to fade into moves within Thursday’s range, initially targeting the monthly pivot point at 24,400. A break beneath this level brings the 24,000 handle into focus, near the 100% projection level.

Chart analysis by Matt Simpson, Source: TradingView, CME Futures, NASDAQ 100 E-mini Futures
S&P 500 Futures (ES) Technical Analysis
The S&P 500’s daily price action mirrors that of the Nasdaq 100 and Dow Jones, with the 1-hour chart showing a lower high ahead of a break below the 200-bar EMA. Prices are now testing the monthly pivot point, suggesting sellers remain in control.
Bears could look to fade rallies within Thursday’s range, anticipating a sustained break beneath the pivot. Momentum currently shows little appetite for a recovery bounce, reinforcing the downside bias.
The monthly S1 support sits near the 6,540 low, offering a logical initial target for S&P 500 bears.

Chart analysis by Matt Simpson, Source: TradingView, CME Futures, S&P 500 E-mini Futures


Dow Jones Futures (YM) Technical Analysis
The daily chart shows the Dow Jones forming a doji near the 2024 high before momentum turned lower. Thursday’s bearish engulfing candle completed an evening star reversal pattern, signalling fading bullish strength. While prices are still holding above the 50-day EMA, the bias favours a break beneath it in the coming sessions.
The 1-hour chart reveals a head-and-shoulders top preceding the recent sell-off, with prices now trading below the monthly pivot point. Bears may look to fade rallies towards the pivot, targeting the monthly S1 at 45,670 and the 45,387 low, with a break below that exposing the 44,983 support area.
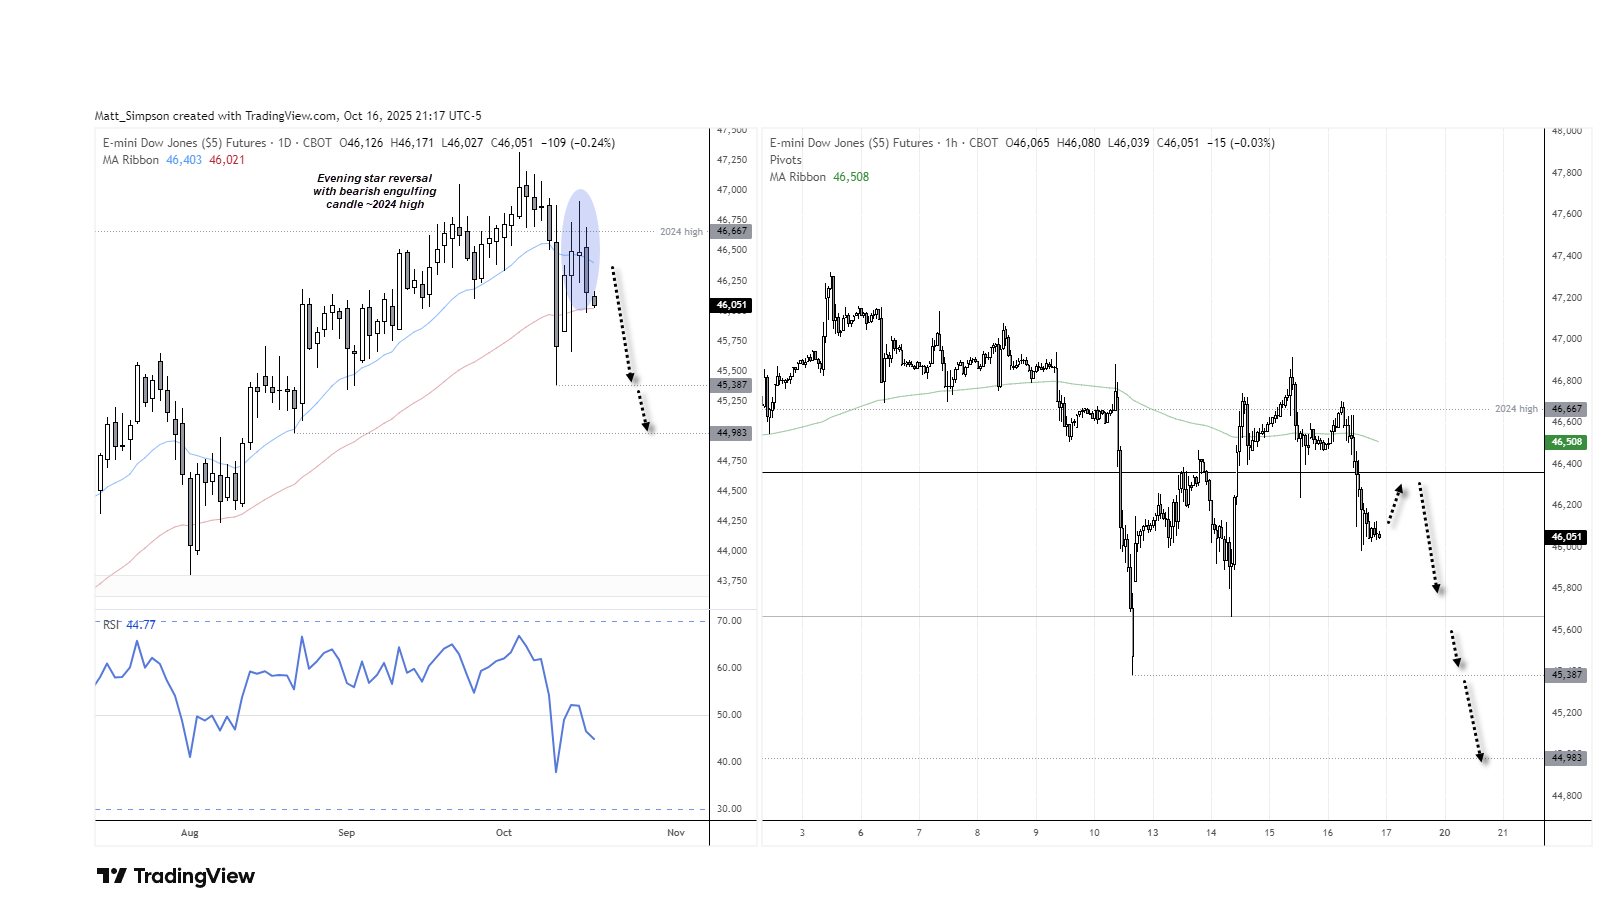
Chart analysis by Matt Simpson, Source: TradingView, CBOT Futures, Dow Jones E-mini Futures
View the full economic calendar
View the full economic calendar
-- Written by Matt Simpson
Follow Matt on Twitter @cLeverEdge
How to trade with City Index
You can trade with City Index by following these four easy steps:
- Open an account, or log in if you’re already a customer
• Open an account in the UK
• Open an account in Australia
• Open an account in Singapore
- Search for the market you want to trade in our award-winning platform
- Choose your position and size, and your stop and limit levels
- Place the trade
Related tags:
Latest market news




Open an account today
Experience award-winning platforms with fast and secure execution.
Economic calendar
Web Trader platform
Our sophisticated web-based platform is packed with features.
Related articles
Rates Shock, Metals Rout Leave Aussie Dollar Under the Pump
The global environment is becoming increasingly hostile for the Aussie. With AUD/USD breaking major support and AUD/JPY threatening further downside, today's jobs report faces an uphill battle to change the picture.


S&P 500 Grasps At Support as Surging Hike Odds, Treasury Yields Threaten Larger Turn
Stocks continue to turn in Q4 and the post-earnings bounce from NVDA has been faded, while the S&P 500 grasps on to a support level with a large amount of open space below.


Euro Short-term Outlook: EUR/USD Plunges to 19-Month Low—Bears Face Critical Test 11 18 2026
The Euro selloff is now approaching pivotal support, raising the prospect of downside exhaustion as the November decline extends.

From time to time, StoneX Financial Pty Ltd (“we”, “our”) website may contain links to other sites and/or resources provided by third parties. These links and/or resources are provided for your information only and we have no control over the contents of those materials, and in no way endorse their content. Any analysis, opinion, commentary or research-based material on our website is for information and educational purposes only and is not, in any circumstances, intended to be an offer, recommendation or solicitation to buy or sell. You should always seek independent advice as to your suitability to speculate in any related markets and your ability to assume the associated risks, if you are at all unsure. No representation or warranty is made, express or implied, that the materials on our website are complete or accurate. We are not under any obligation to update any such material.
As such, we (and/or our associated companies) will not be responsible or liable for any loss or damage incurred by you or any third party arising out of, or in connection with, any use of the information on our website (other than with regards to any duty or liability that we are unable to limit or exclude by law or under the applicable regulatory system) and any such liability is hereby expressly disclaimed.