



Rates Shock, Metals Rout Leave Aussie Dollar Under the Pump
The global environment is becoming increasingly hostile for the Aussie. With AUD/USD breaking major support and AUD/JPY threatening further downside, today's jobs report faces an uphill battle to change the picture.
Share this:

- Australia's two-year yield advantage over US slumps 90bp
- History shows AUD struggles when US financial conditions tighten rapidly
- RBA December hike probability sits at just 17.2%
- AUD/USD breaks 0.6750 as AUD/JPY loses long-running uptrend support
As a high-yielding risk asset closely tied to the fortunes of the global economy, the Australian dollar could hardly face a more toxic backdrop outside a full-blown financial or economic crisis. US financial conditions are tightening rapidly, volatility is picking up and metals prices are getting hammered. Little wonder the Aussie is being buffeted by offshore forces.
Throw in a softening domestic economic picture and the dramatic contraction in Australia's yield advantage over other G10 economies and the headwinds facing the 'battler' become even stronger.
Today, the focus on offshore developments will be briefly interrupted by Australia's October employment report. The release could keep the prospect of further RBA tightening alive or snuff it out altogether should the recent deterioration in labour market conditions continue. Any volatility sparked by the release may prove to be short-lived, with external forces likely to reassert themselves later in the session.
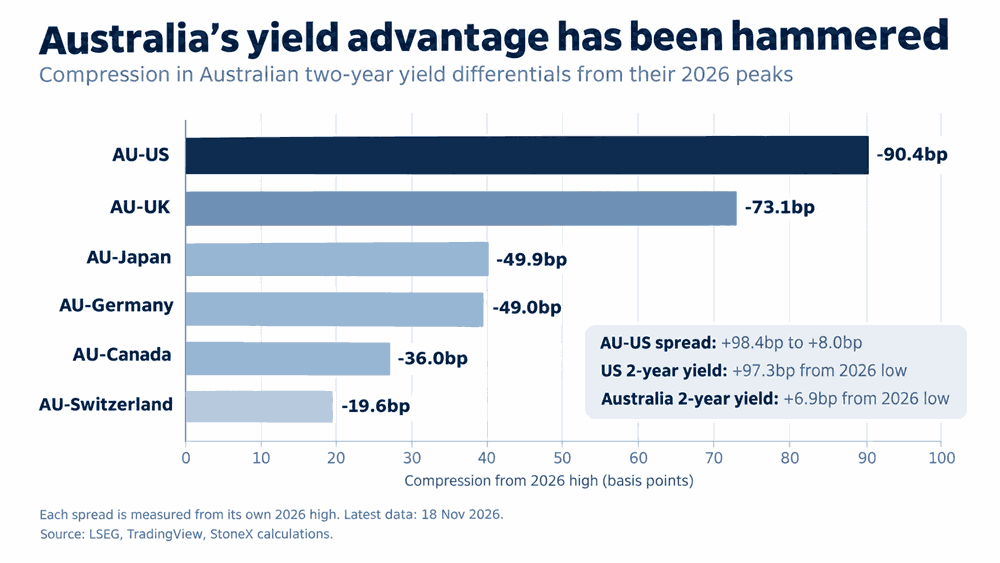
Australia's yield advantage has been hammered
Source: LSEG
Offshore, US economic data surprises have surged to multi-year highs, while renewed hawkishness from the Fed has driven a sharp repricing of the US interest rate outlook. Influential Fed Governor Christopher Waller has again raised the possibility of a 50 basis point hike in December, or consecutive 25 basis point increases in December and January. Alongside higher energy prices, the repricing has helped drag bond yields higher globally.
At the same time, Australia's domestic economic pulse has weakened noticeably, with unemployment trending higher. The RBA's dovish rate hike last week, which saw three board members dissent in favour of leaving rates unchanged, has added to concerns about the domestic outlook and the sustainability of further tightening.
Combined, these forces have hammered Australia's relative yield advantage, particularly against the US, where the two-year bond yield spread has narrowed by more than 90 basis points from its 2026 high, falling from 98.4 basis points to just eight. Similar compression against other major G10 economies has eroded support for the Aussie at a time when external pressures are already amplified.
Unemployment holds the key to RBA pricing
Ahead of Thursday's October jobs report, cash rate futures assign just a 17.2% probability of another 25 basis point hike in December, with barely a handful of basis points of tightening priced into next year. Effectively, the market is saying the RBA is done.
While that pricing was challenged by yesterday's punchy Q3 wages data, up 1.1% for the strongest quarterly rise in almost three years, the Fair Work Commission's sizeable minimum wage increase and several large enterprise agreements helped drive the result, raising doubts about whether that pace can be sustained.
To gauge that risk, the emphasis will be on the unemployment rate in today's release, due at 11:30am AEDT. It's expected to remain steady at 4.7%, in line with the RBA's forecast average for the December quarter. Another upside surprise, as witnessed in recent reports, would cast further doubt over the need for additional tightening, even with inflation still running well above the RBA's 2.5% target.
As a lagging indicator, a further rise in unemployment would reinforce concerns that cyclical parts of the Australian economy are slowing rapidly, potentially paving the way for weaker wage growth, softer demand and slower economic growth. Conversely, an undershoot will keep alive the prospect of another RBA hike as soon as next month.
On the wages front, youth unemployment, underemployment and broader labour underutilisation will also be closely scrutinised, particularly the latter two given their historically strong inverse relationships with wage pressures.
Tightening financial conditions hammer the Aussie
Source: TradingView, LSEG
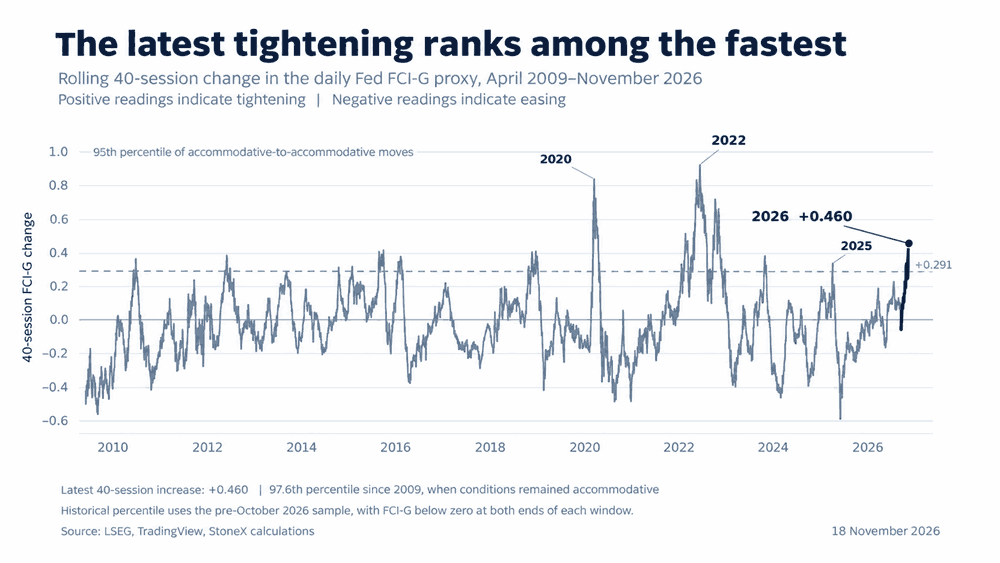
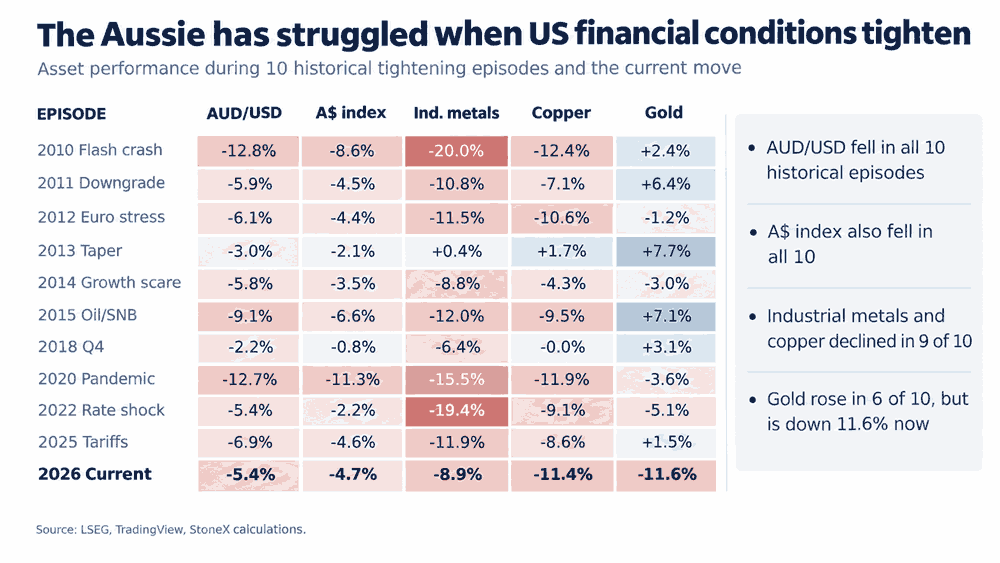
Far exceeding the headwinds emanating from domestic factors, the external environment buffeting the Aussie is becoming more hostile by the day. Rapid tightening in US financial conditions is wreaking havoc with risk appetite, driving risk assets lower and volatility higher. Our research shows the current pace of tightening sits around the 98th percentile of comparable 40-session readings going back to 2009. AUD/USD declined in all 10 equivalent episodes examined, while industrial metals and copper fell in nine.
Source: TradingView, LSEG
On this occasion, metals have been particularly hard hit, with iron ore slumping to four-year lows amid mounting concerns about China's construction sector and steel production. Industrial metals more broadly are also getting hammered by the stronger US
AUD/USD: Selling rallies remains the preferred strategy
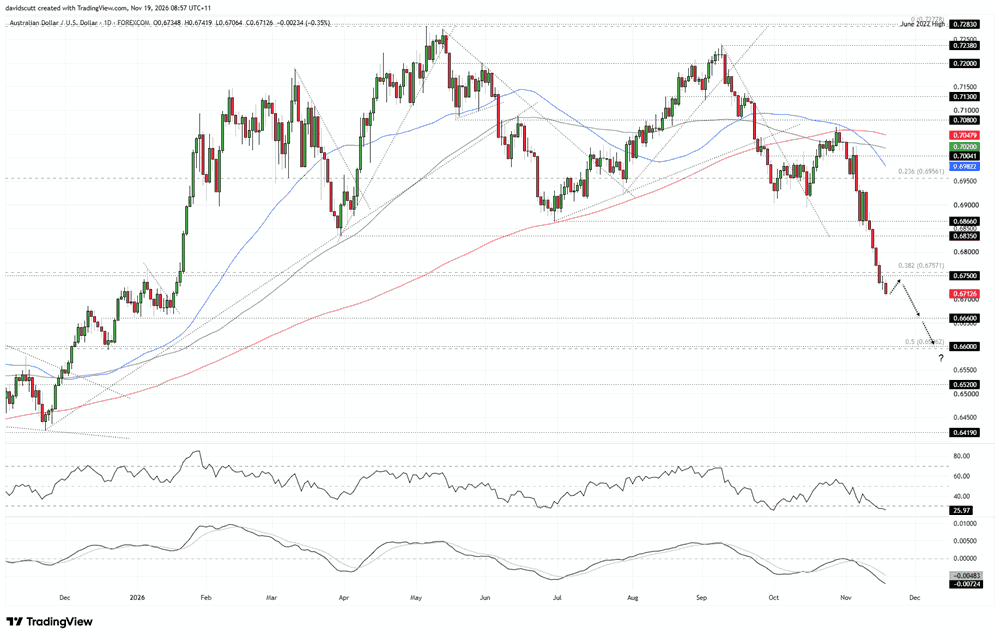
Given the toxic domestic and external backdrop, it comes as no surprise that AUD/USD looks horrible on the charts. The price fell to its lowest level since early January this week, slicing through a key support zone around 0.6750–0.6757, comprising the 38.2% Fibonacci retracement of the April 2025 to May 2026 bull move and 0.6750, a level that previously acted as both support and resistance.
Source: TradingView
Downside momentum continues to build, with RSI (14) making lower lows and MACD pulling further away from its signal line deep in negative territory. That message is reinforced by the price trading beneath its 50, 100 and 200-day moving averages, all of which are sloping lower, with their downward trajectories accelerating.
While RSI (14) has moved into oversold territory, creating conditions conducive to a near-term squeeze, the broader picture still favours selling rallies and retaining a bearish bias. If the price squeezes back towards 0.6750–0.6757 without a significant improvement in the external environment, that would be a zone to consider initiating fresh shorts.
On the downside, 0.6660 is the first target, having acted as support and resistance late last year and earlier this year. Below that, 0.6600 is another level of note, bolstered by the 50% retracement of the broader 2025–2026 bull move around 0.6596.
Should AUD/USD recover 0.6750–0.6757 on a sustained basis, 0.6835, the swing low set in May 2026, would be the next upside level to watch.
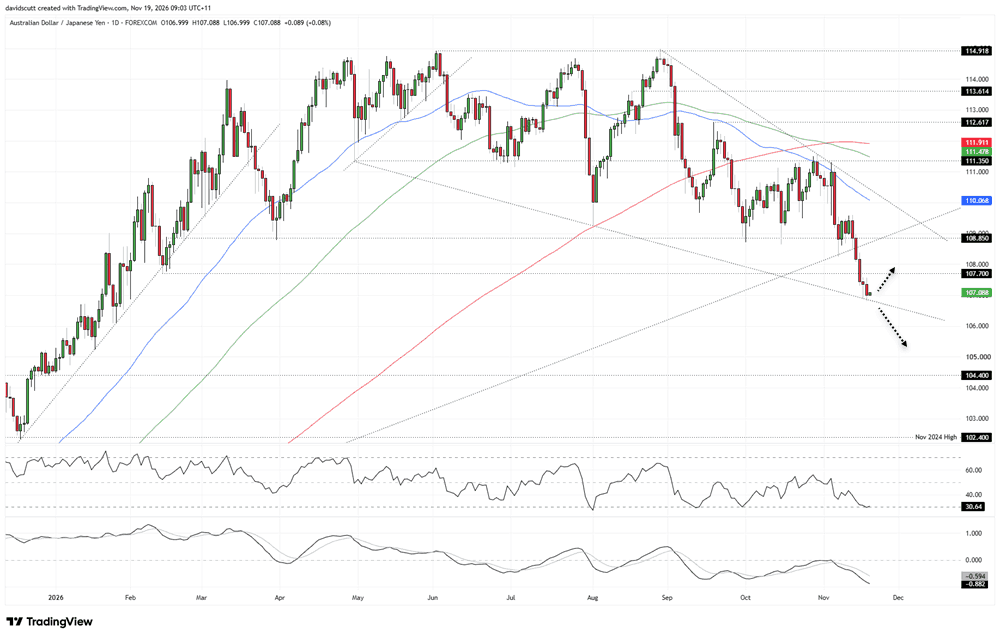
AUD/JPY: Carry trade pressures intensify
Source: TradingView
The Aussie has long been favoured by Japanese investors seeking yield pickup via carry trades. Yet AUD/JPY has now turned lower even as Australia's yield advantage over Japan has widened over shorter windows. That suggests tightening financial conditions and deteriorating risk appetite are overwhelming the support normally provided by relative interest rates.
The Aussie has broken beneath its 50, 100 and 200-day moving averages, along with long-running uptrend support dating back to the May 2025 lows. It's also lost 108.85, a level that repeatedly acted as support and resistance, and more recently 107.70, the low set in February this year.
The latest breakdown has brought the price towards descending trendline support dating back to April. Combined with the sequence of lower highs on the daily timeframe, the structure resembles a falling wedge, a potentially bullish formation. The oscillators, however, are telling a different story. RSI (14) continues to make lower lows well beneath 50, while MACD has staged a bearish crossover in negative territory and continues to pull away from its signal line.
Before entertaining a bullish reversal, we'd need to see the descending support hold and, more importantly, a break above downtrend resistance extending from the August highs. We're clearly not there yet. Should the price bounce from the descending support, 107.70 and 108.85 become the initial levels to watch overhead.
If support gives way, there's little of significance immediately underneath. Some residual buying interest may emerge around 106, where the price spent time late last year and earlier in 2026. Beyond that, 104.40 is the next downside level to watch, followed by 102.40, the November 2024 high that subsequently acted as both support and resistance late last year.
Latest market news




Open an account today
Experience award-winning platforms with fast and secure execution.
Economic calendar
Web Trader platform
Our sophisticated web-based platform is packed with features.
Related articles
Rates Shock, Metals Rout Leave Aussie Dollar Under the Pump
The global environment is becoming increasingly hostile for the Aussie. With AUD/USD breaking major support and AUD/JPY threatening further downside, today's jobs report faces an uphill battle to change the picture.
Euro Short-term Outlook: EUR/USD Plunges to 19-Month Low—Bears Face Critical Test 11 18 2026
The Euro selloff is now approaching pivotal support, raising the prospect of downside exhaustion as the November decline extends.


Copper forecast: risk-off mood and demand worries sink prices below $6
Copper has broken below $6, its 200-day moving average and a trend line dating back to August 2025. With industrial metals under pressure and the dollar firm, $5.50 is now the level to watch.

From time to time, StoneX Financial Pty Ltd (“we”, “our”) website may contain links to other sites and/or resources provided by third parties. These links and/or resources are provided for your information only and we have no control over the contents of those materials, and in no way endorse their content. Any analysis, opinion, commentary or research-based material on our website is for information and educational purposes only and is not, in any circumstances, intended to be an offer, recommendation or solicitation to buy or sell. You should always seek independent advice as to your suitability to speculate in any related markets and your ability to assume the associated risks, if you are at all unsure. No representation or warranty is made, express or implied, that the materials on our website are complete or accurate. We are not under any obligation to update any such material.
As such, we (and/or our associated companies) will not be responsible or liable for any loss or damage incurred by you or any third party arising out of, or in connection with, any use of the information on our website (other than with regards to any duty or liability that we are unable to limit or exclude by law or under the applicable regulatory system) and any such liability is hereby expressly disclaimed.