
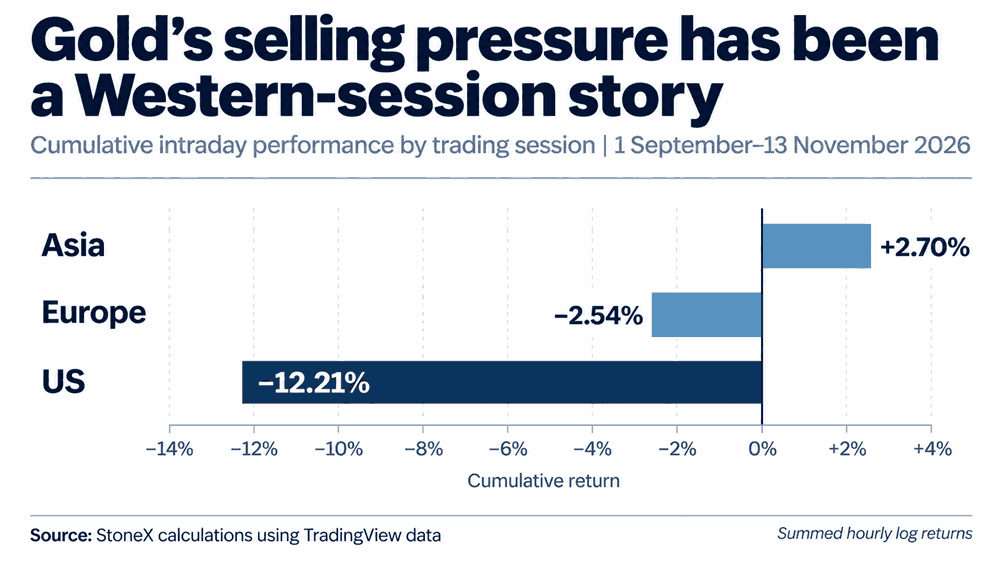
- Gold gains 2.7% in Asia since September, US losses 12.2%
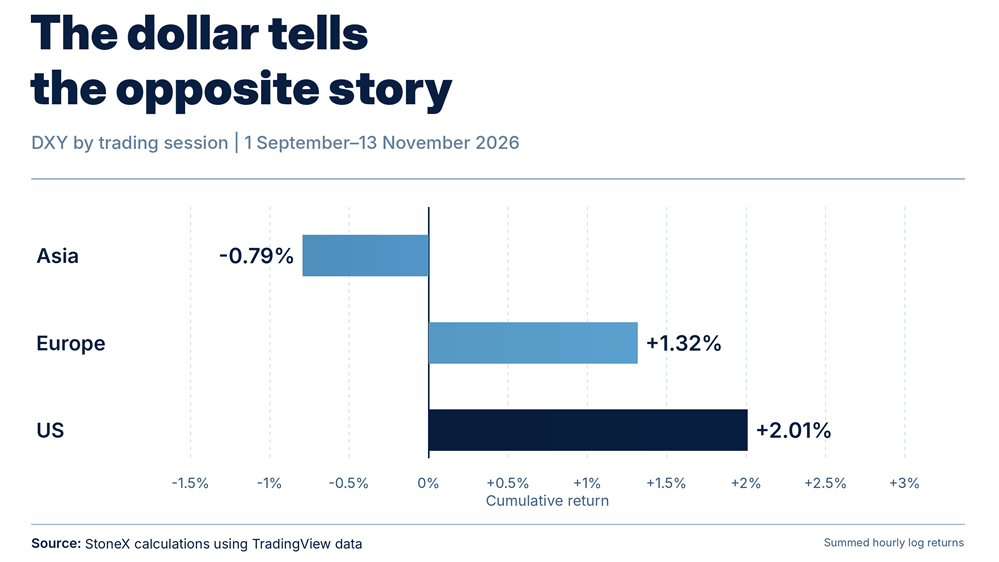
- DXY strengthens in Western trading hours since September
- US two-year yields surge 35.2bp in historic weekly move
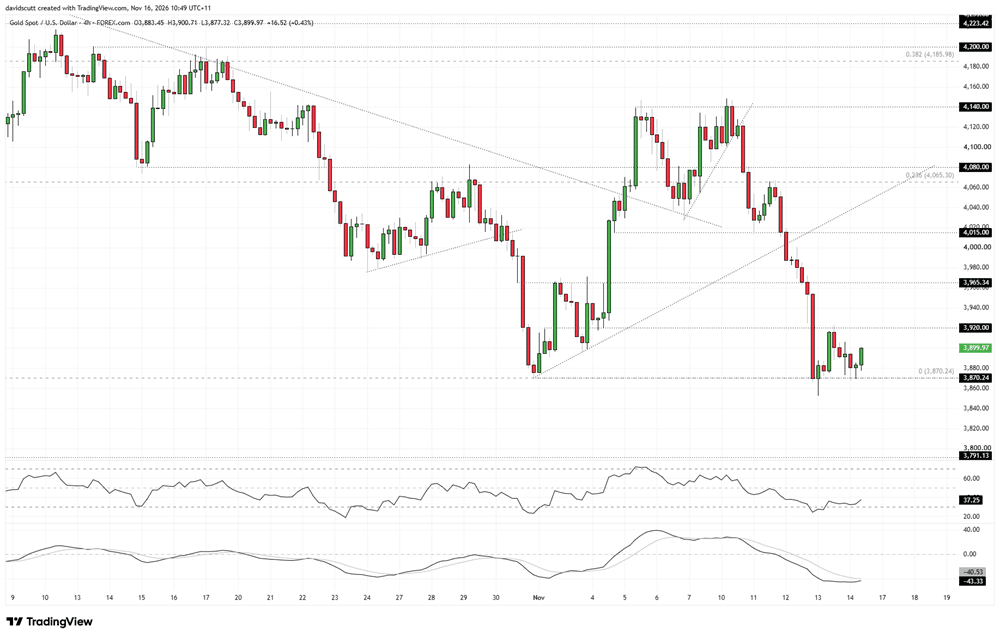
- Gold clings to $3,870 support as downside risks mount
Gold finds itself clinging to key support after yet another ugly reversal late on Friday, leaving the price dangerously close to a breakdown that could trigger another leg lower in the prevailing bearish trend.
The latest reversal fits a pattern I've picked up on recently, where fleeting bounces during Asian trading have often been sold into with gusto as Europe and the US come online. Rather than rely solely on visual recollection, I decided to test that hunch against hourly price data. And what do you know? Asia buys the dip, Europe and particularly the US sell the rip.
With US economic surprises surging, Treasury yields ripping higher and gold's sensitivity to the dollar near historical extremes, the toxic backdrop keeps directional risk firmly skewed to the downside entering the new trading week.
Asia buys the dip, the US sells the rip
Analysis of hourly gold price movements since the beginning of September reinforces the vastly different performances across Asian, European and US trading hours, extending a pattern that has been evident at various stages earlier this year.
Source: TradingView
Over this period, gold has recorded cumulative gains of 2.7% during Asian trading hours (from 9am Tokyo time until the London open), compared with declines of 2.5% in Europe (8am London to 8am New York) and a whopping 12.2% during the US session (8am–5pm New York). Session boundaries have been adjusted for daylight saving.
The divergence in performance has become particularly pronounced over the past three months, with gold recording negative net returns during European and US trading in September, October and November, while Asia has generally continued to buy dips, delivering positive returns in two of those three months. It's been the US session that's proved especially punishing for the precious metal, accounting for the overwhelming majority of the bearish unwind.
As touched upon above, this isn't a recent phenomenon either. Looking across all of 2026, Asian trading hours have contributed cumulative gains of 3.4%, compared with declines of 0.9% in Europe and a staggering 28.1% during US trading. While the pattern hasn't been consistent every month, the concentration of selling pressure during US trading hours is something gold traders would do well to keep in mind.
This content was created by an affiliate of FOREX.com and represents the views and opinions of the author/speakers, not the views and opinions of FOREX.com, StoneX Group Inc., or its subsidiaries. The content has not been independently reviewed by FOREX.com.
Dollar strength reinforces gold's regional divide
Interestingly, and perhaps helping explain gold's performance during US trading hours, the US Dollar Index (DXY) has exhibited a similar pattern, only in reverse. Since September, the dollar has declined 0.8% during Asian trading, compared with gains of 1.3% in Europe and 2% in the US. The dollar has also weakened during Asian hours in each of the past three months, with Europe reporting the opposite outcome. US trading has been less consistent, with DXY declining in October, potentially reflecting bouts of volatility in the technology sector.
Source: TradingView
The inverse relationship has also been strongest during US trading, with the hourly correlation between gold and DXY standing at −0.57 since September, compared with approximately −0.32 in both Asia and Europe.
The relationship is especially relevant given our previous research showing gold's sensitivity to dollar movements has surged to near historical extremes. The 252-session gold/DXY beta stood at −2.47, ranking in the 99th historical percentile, suggesting even modest dollar gains have the potential to generate substantial selling pressure on the precious metal.
US rate shock adds to gold's woes
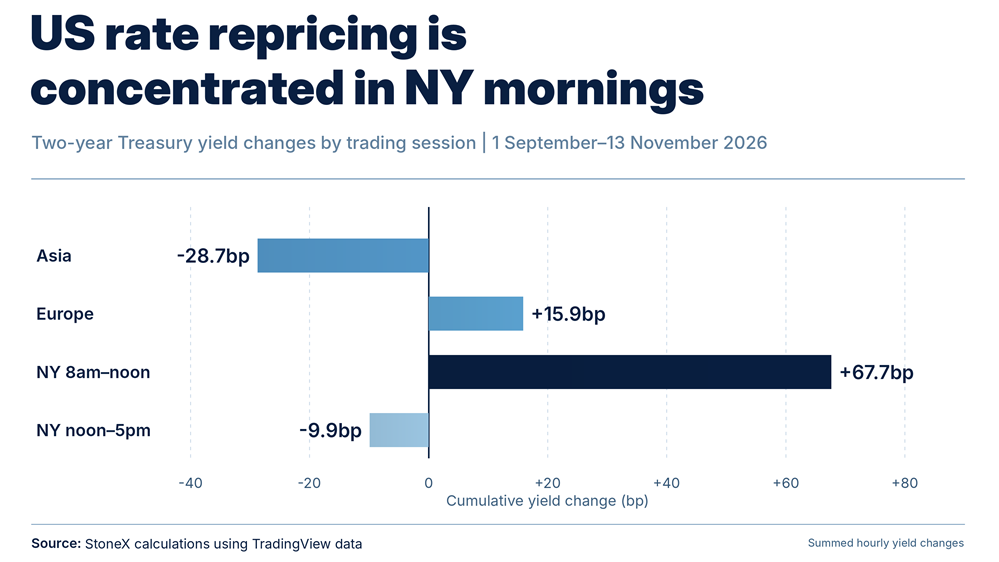
The regional divide becomes even more apparent when US short-dated yields are brought into the equation. Since September, the vast bulk of yield increases has occurred during the New York morning, accounting for 67.7 basis points of cumulative upside, compared with a decline of 28.7 basis points in Asia and a far smaller increase of 15.9 basis points in Europe. Early US gains have often fizzled in the New York afternoon, which has recorded a cumulative decline of 9.9 basis points over the period.
Source: TradingView
Taken together, the strongest upward pressure on yields has occurred during the very hours gold has been hit hardest, highlighting just how hostile the macro backdrop has become for a non-yielding precious metal priced in US dollars.
Last week was especially unpleasant for bullion. As covered in our USD/JPY weekly outlook, US two-year Treasury yields surged 35.2 basis points, the 10th-largest weekly increase since 2000, as stronger economic data and hawkish Fed commentary fuelled a dramatic repricing of the Fed interest rate outlook. With Citi's US Economic Surprise Index reaching its highest level in more than three years, positive economic surprises have provided further fuel for yields and the dollar to push higher, to the detriment of gold.
And gold's reaction was extreme even by historical standards. Research published last week showed its 4.74% decline over four sessions was the second-largest among 72 comparable rate shocks, with the scale of the sell-off far exceeding what dollar strength alone would have suggested.
$3,870 remains line in the sand
Source: TradingView
Lo and behold, Asian traders have started the new week buying the dip in gold once again, coinciding with an improvement in risk appetite following Financial Times reports of a coordinated push among Jensen Huang's supporters to have him reinstated as Nvidia CEO.
On the four-hourly chart, support at $3,870.24 continues to hold, establishing a near-term trading range capped by resistance at $3,920. With the price sitting around the middle of that range, there's scope for another push higher should risk appetite remain firm. RSI (14) is starting to curl higher, setting higher lows, while MACD is also turning towards its signal line in negative territory. Both suggest downside momentum is easing, at least for now.
However, given the magnitude of the preceding sell-off, gold remains a sell-on-rallies proposition over longer time frames, even if opportunities exist to trade in both directions over shorter periods.
On the downside, a break beneath $3,870.24 that sticks, preferably followed by a backtest and rejection, would allow for shorts to be established with a tight stop above the level for protection, targeting $3,791.13. Traders should also be mindful of Friday's false break to $3,852.60, which provides another nearby reference point should support give way.
Overhead, $3,920 looms as either a take-profit zone for longs or a potential entry point for shorts. An attempted break above the level was slapped back lower during European trading on Friday, suggesting another failed push could provide an opportunity to establish shorts beneath resistance, with a tight stop above and an initial target of $3,870.24. Alternatively, a break above $3,920 that sticks would shift attention to $3,965, a level that has acted as both support and resistance previously.