
Key Events
- U.S. Non-Farm Payrolls data cast a shadow of uncertainty over recoveries in U.S. indices as the government shutdown continues.
- Nasdaq peaked at 26,300, attempting to recover from the 25,000 level.
- Dow Jones topped near 48,000, working to stabilize above 47,000.
- The key question: Is the momentum correction over?
Following a strong rally in response to bullish mega-cap earnings, U.S. indices hit major resistance levels, prompting a rebalancing of momentum down to critical support zones. The Dow Jones advance stalled near 48,000, before retracing by more than 1,000 points, pulling back from the upper boundary of a consolidation phase that has been in place since the positive rebound from 2020.
Meanwhile, the Nasdaq was capped below 26,300, aligning with the 100% Fibonacci extension of the August–October 2025 rally.
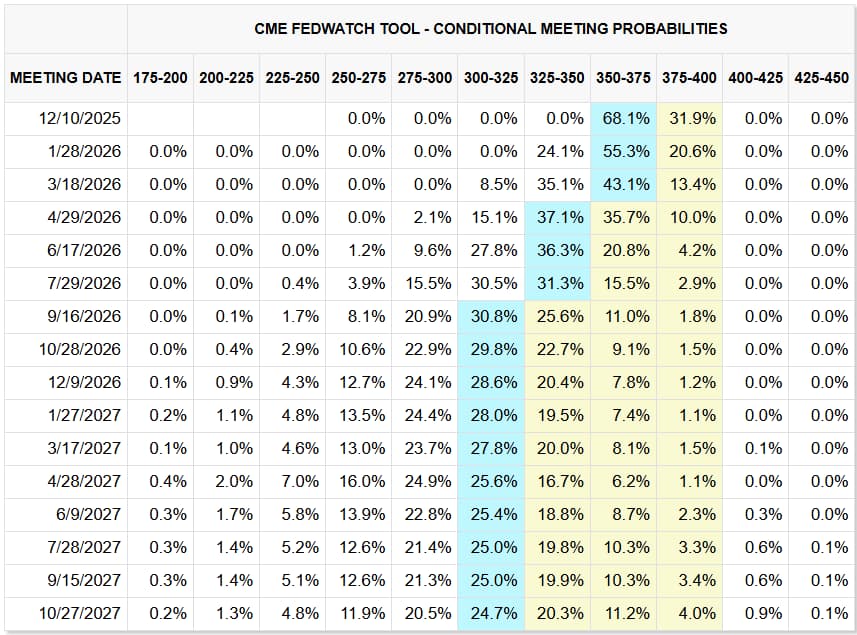
Source: CME Fed watch Tool
While U.S. indices retain an optimistic tone supported by rate cut expectations onto 2026, the DXY continues to hold a hawkish stance, partly due to the ongoing government shutdown and the market’s priced-in outlook for future rate cuts toward the dollar’s 2025 lows.
Either way, key levels remain critical in determining the sustainability of these trends. Given the extended shutdown and absence of major labor data, downside risks remain valid for the indices and their 2025 highs.
Nasdaq Outlook: Daily Time Frame – Log Scale
Source: Tradingview
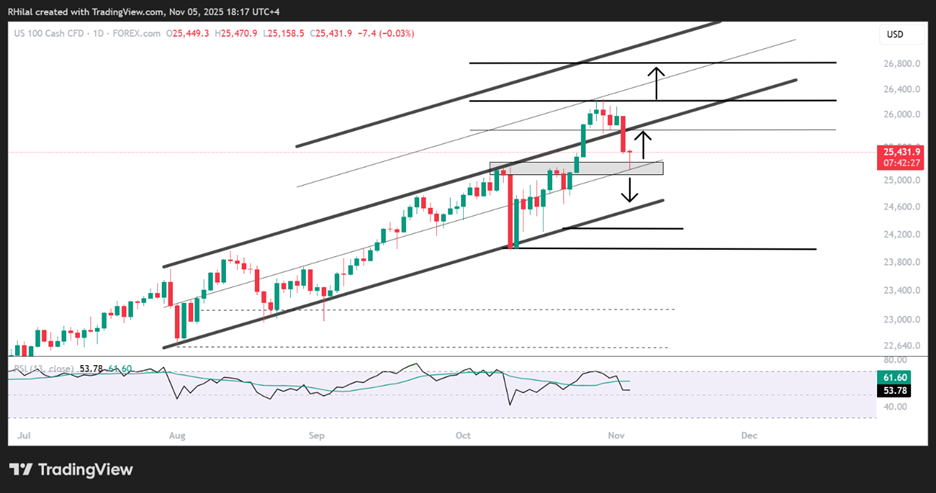
Since August 2025, Nasdaq’s price action has followed a parallel channel range, repeatedly respecting both its upper and lower boundaries. The index broke above the upper limit during the earnings-driven rally fueled by rate cut expectations, stretching toward the mid-zone of the duplicated channel near the 26,300-resistance.
A classic technical analysis approach involves confirming a parallel channel breakout and duplicating the range in the breakout’s direction to estimate potential targets and retracement areas. In this case, 26,300 coincides with both the mid-zone of the duplicated channel and the 100% Fibonacci extension of the August–October 2025 rally. This led to a pullback toward the mid-zone of the original channel, around the 25,100–25,400 support area.
The next level to confirm a continuation of the broader upward move is 25,700, followed by 26,300.
A breakout above these levels would open the way for new records toward the upper boundary of the duplicated channel near 26,700–26,800.
From the downside, a confirmed close below 25,100 could trigger a sharper retracement toward the lower boundary of the original channel near 24,700, where either a renewed base could form for another rebound or a deeper retracement toward 24,200 could follow.
Dow Jones Outlook: Monthly Time Frame – Log Scale
Source: Tradingivew
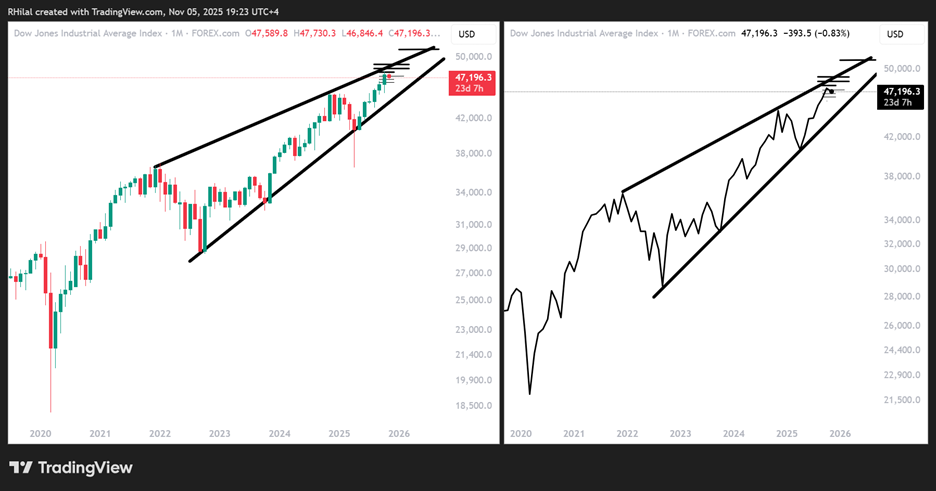
From a monthly perspective, and filtering out short-term noise using the line chart, the Dow’s price action has been contracting since its bullish rebound from the 2020 lows, with overbought momentum previously recorded in November 2024 and April 2021.
This setup highlights the potential for long-term reversal risks near the upper boundary — specifically along the trendline connecting consecutive higher highs from January 2022 through November 2024.
If the trend extends beyond the 48,000 resistance, further advances could target 48,400 and 49,000, with 51,000 seen as an extreme projection before another major correction phase.
Conversely, a confirmed hold below 46,900 would indicate renewed pressure, potentially driving prices toward 46,600 and 46,200, where a technical rebound could occur.
If not, a deeper retracement toward the 45,000 region may emerge.
Written by Razan Hilal, CMT
Follow on X: @Rh_waves