Nasdaq, NVDA Talking Points:
- The NVDA headlines over the weekend were brutal but after gapping-down the stock is bouncing to start the week.
- Both Nasdaq 100 Futures and NVDA went into oversold territory on the daily chart last week, and that’s the first such occurrence of that since the April 2025 lows.
- This, of course, does not mean that a low has to be in place but it does raise the bar for sellers given how aggressively the move has priced-in. Perhaps the bigger question is whether any bounces turn into a bull trap given the shifting backdrop of macro and that will likely gain further definition this week as CPI data is set to be released tomorrow.
Oversold and overbought conditions do not mean that a reversal has to play in. It does, however, highlight how chasing the move further in that direction can be a challenge. If there’s an overarching reason for sellers to continue pushing in an already oversold market, such as we saw in the USD/JPY market back in July and August of 2024, well, it doesn’t really matter what RSI is showing.
In a market such as we have with both the Nasdaq 100 and the leader of the AI push of NVDA, the drastic change is that much more impressive. It was just a month ago that both markets hit fresh all-time-highs. All was not well, however, especially with NVDA, as the stock went from that fresh ATH to a bearish engulf on the weekly chart, and this was a centerpiece of that week’s Top 5 Charts video. The next week, a bearish engulf printed in S&P 500 Futures, and that led to a continued unfurling that pushed all the way into last week’s close. While it’s simple to point at rates or inflation or election results as a catalyst, the reality is the backdrop was brewing well in advance.
This content was created by an affiliate of FOREX.com and represents the views and opinions of the author/speakers, not the views and opinions of FOREX.com, StoneX Group Inc., or its subsidiaries. The content has not been independently reviewed by FOREX.com.
Nasdaq 100
What’s so different from a month ago?
A democrat win of both chambers of Congress was already expected at the time, although perhaps not to the degree that it happened. Treasury rates were far higher, as the 10-year was cresting at a fresh multi-decade high, and since, we’ve seen more than 50 bps of easing in the benchmark Treasury. And the Fed, by and large, was in exactly the same spot that they are right now, expected to hike in December after making not move in October, as was largely priced-in at the time.
Perhaps the biggest change over the past month is sentiment, as the fresh all-time-highs from early-October, just weeks after the FOMC rate hike, have given way to fear of an AI bubble collapse. And, to be sure, I do think there are many bubble features of the AI theme, as I’ve been writing about for years now.
But I also question as to whether any bubble popping will happen in a clean and uniform manner, and the oversold condition we saw pop up in the Nasdaq last week is one big reason why. It makes it difficult for sellers to continue to push unless they have some overarching reason to do so. If yields are high, well, there’s an opportunity cost. But, at this point, with the Treasury expected to load up supplies in the coming months and yields already down 50 bps or more, that opportunity cost isn’t so attractive.
But perhaps more to the point, topping events rarely happen like a light switch getting flipped. Normally, and this is what we saw in the year 2000, there’s a rocking back and forth, with an aggressive bearish event followed by a bounce, and commonly considered as a bull trap. Until, ultimately, bulls shy away from re-testing prior highs and that provides an open door for longer-term buyers to wiggle out of positions. And then after a lower-high, the door opens for a lower-low and that’s when the motivation to unwind positions ahead of a larger drawdown becomes more attractive.
The chart below shows Nasdaq 100 Futures in the year 2000, which showed a whopping 40% sell-off before a 45% bounce. But it was from that bounce, and the lower-high that printed, that the tech boom became the tech bust as an 81% sell-off followed over the following two years.
Nasdaq 100 Futures July 1999-January 2003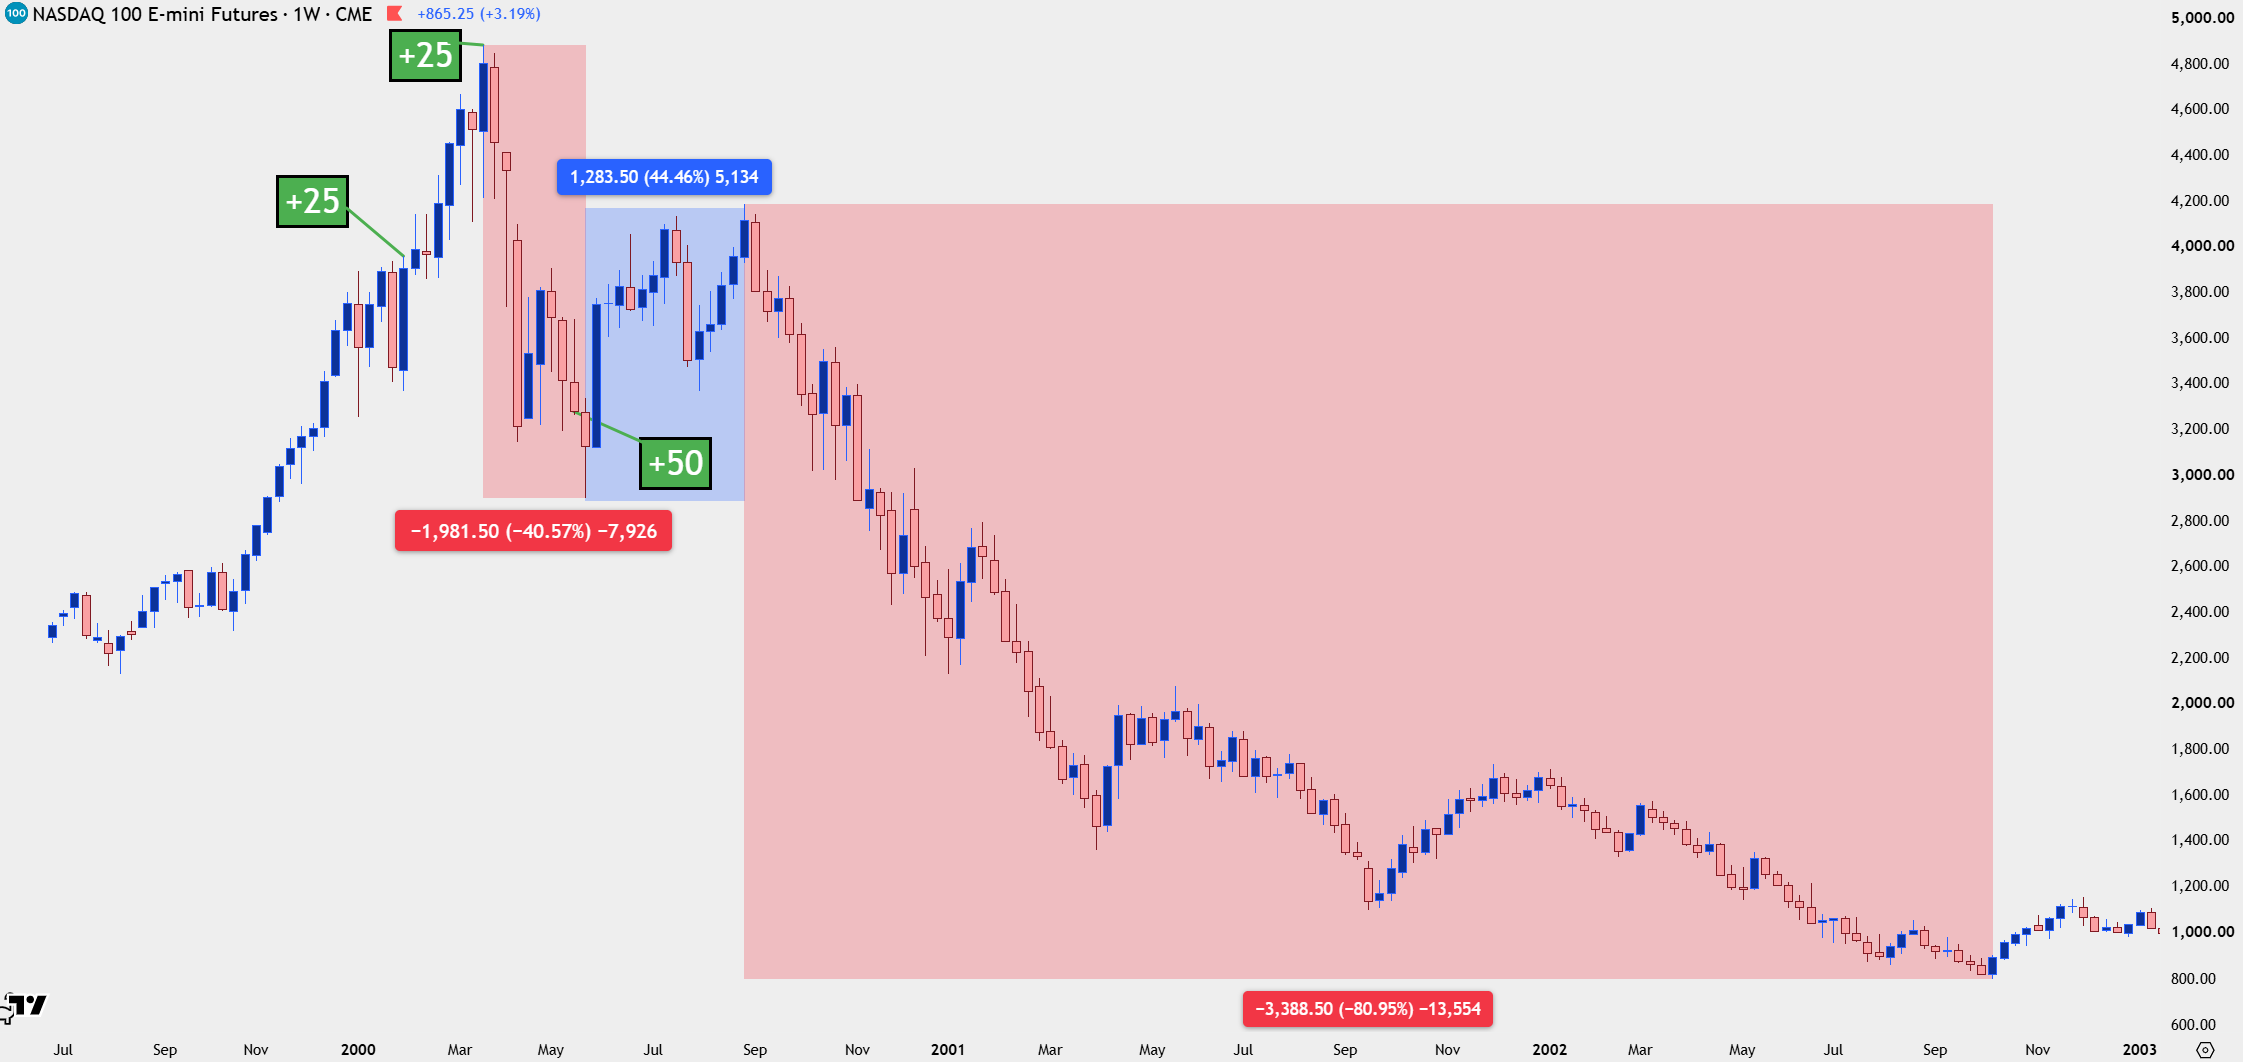
Chart prepared by James Stanley; data derived from Tradingview
By comparison, the current sell-off in NQ has been mild, at a maximum of just over 16% from the highs of a month ago. And, at this point, price is bouncing from a major spot as support is showing at prior resistance from earlier this year, right around the 26,380 level.
But the bigger test of whether this will turn into anything more than an oversold bounce is how sellers respond to resistance – whether we get that hurried exit from longs trying to take advantage of a bounce to get out before a larger sell-off may take over; or whether buyers continue to press. And tomorrow’s CPI report will likely have something to do with that.
There’s a big spot of confluent resistance overhead, plotted around 28,310. And then above that, a major spot of support and this was the same that set the high last Thursday before sellers really pushed, and that plots right around the 29k level.
Nasdaq 100 Daily Price Chart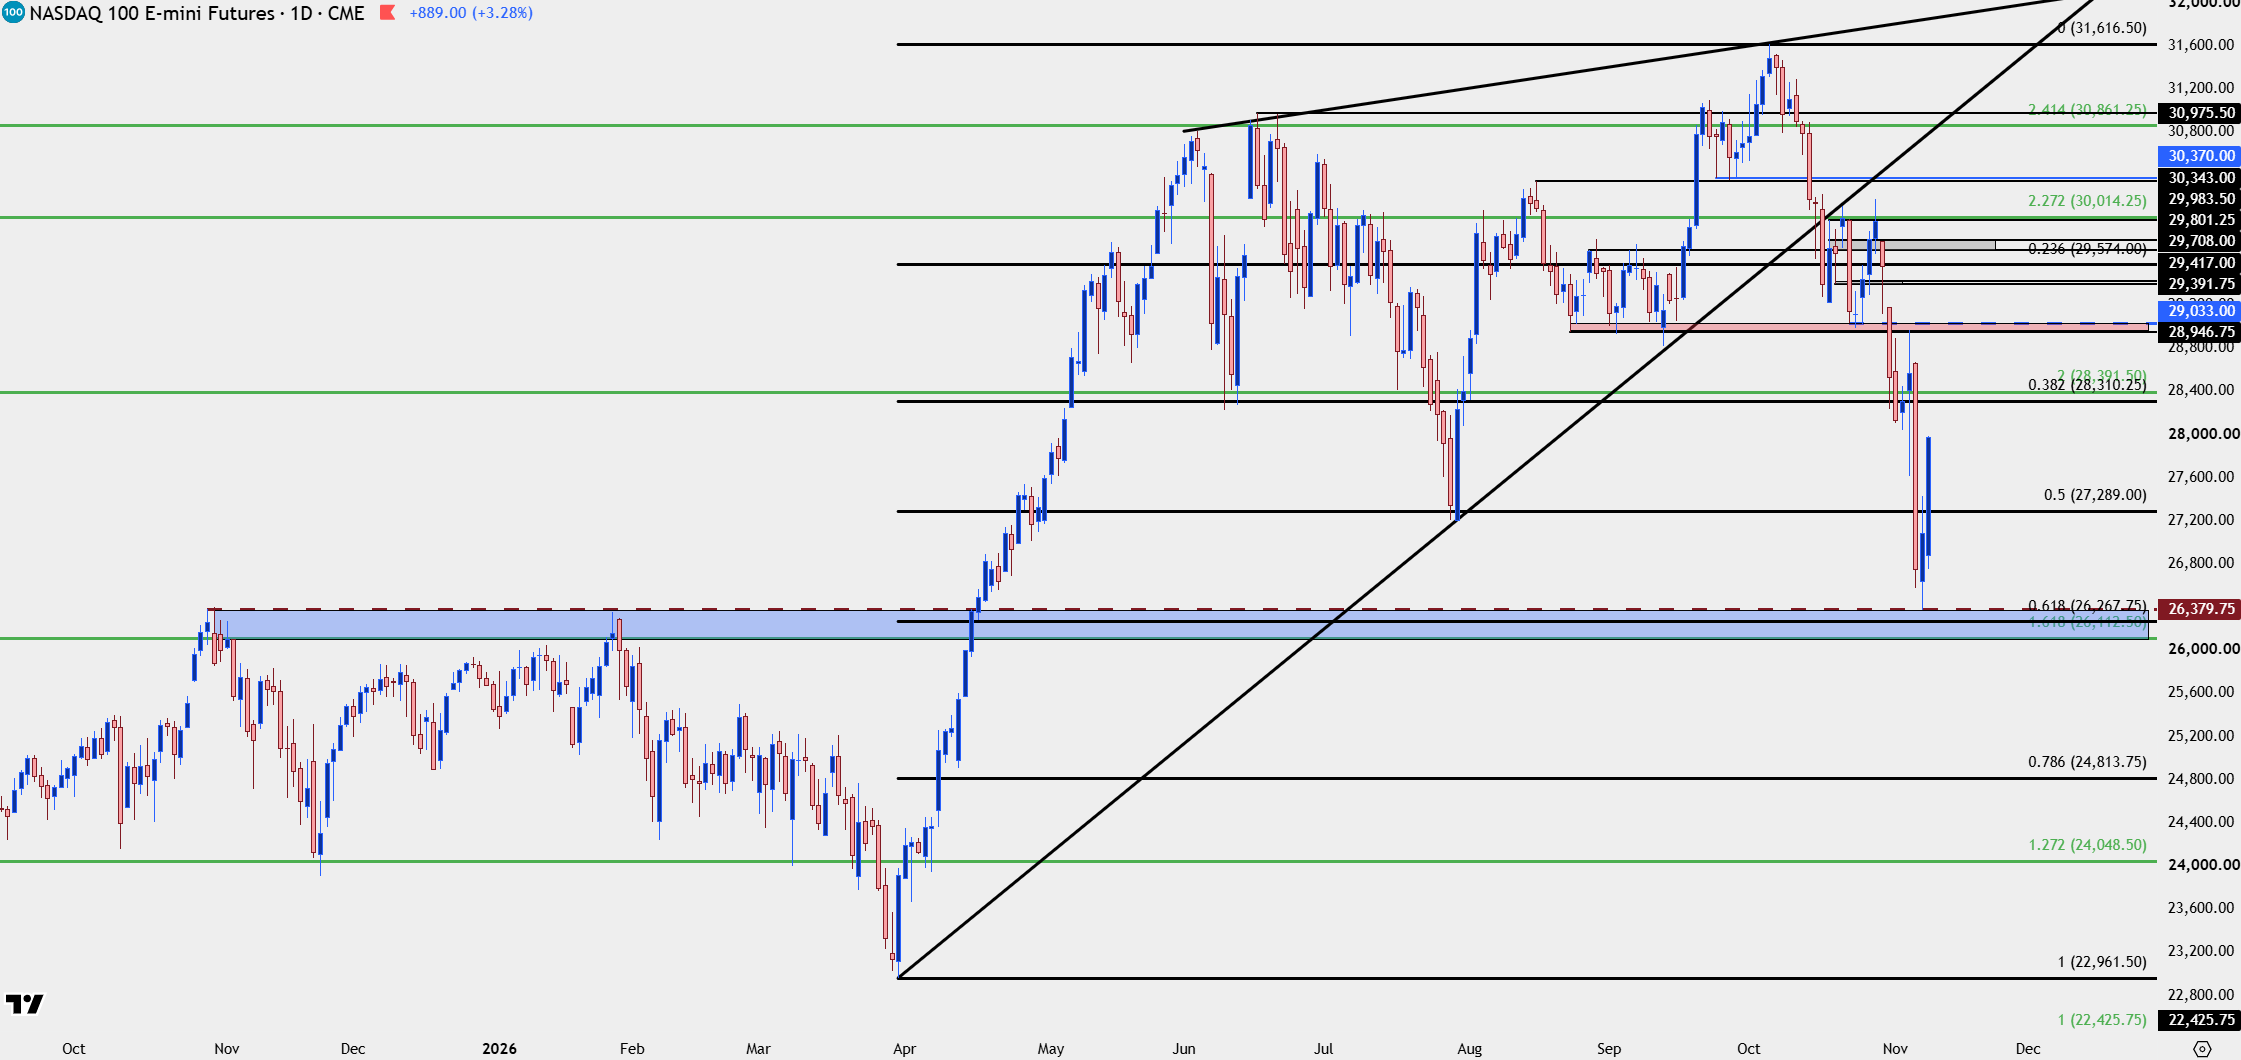
Chart prepared by James Stanley; data derived from Tradingview
NVDA
At this point NVDA is carrying a trailing 12 months P/E ratio of around 23, which, amazingly, is about half of what Wal-Mart trades with. This goes to show that there has been some rather extreme selling in the stock even though quarterly earnings results haven’t been all that bad. This also highlights the importance of positioning and sentiment, particularly over fundamentals which can take time (and volatility) to properly price in.
I’ve been tracking the stock as a barometer of larger market activity and the level that I’ve been highlighting at 210 has proven to be significant. As that level was lost two weeks ago, along with the bearish break of the rising wedge, sellers have absolutely taken over.
A move of that nature compels longs to close and as we’ve seen panic perk up, there’s been continued offloading. The question now, however is whether that panic has peaked, or whether there’s more to come. The last time we had a similar event in NVDA when RSI went into oversold territory, it was near a significant low back in April of 2025. That was followed by a massive rip that saw the stock appreciate by more than 100% over the next six months – and this was already at more than $1 trillion in market cap at the time.
NVDA Daily Chart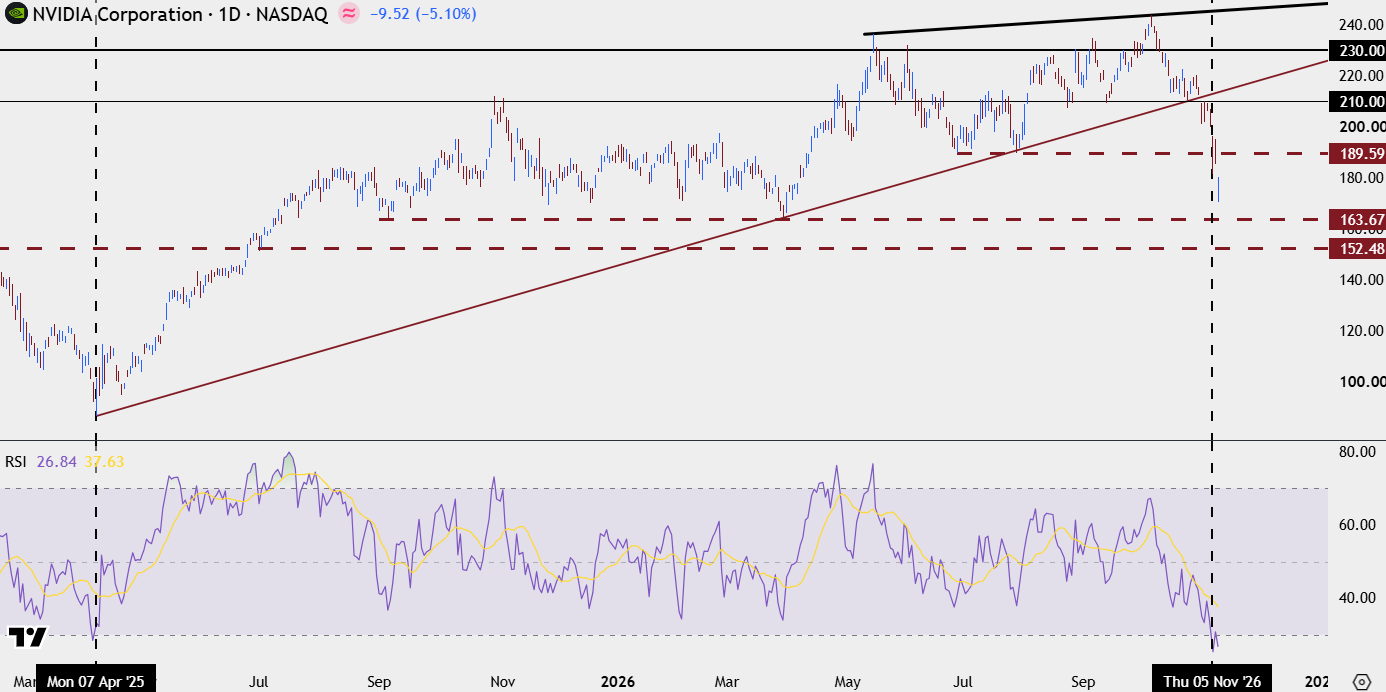
Chart prepared by James Stanley; data derived from Tradingview
--- written by James Stanley, Senior Market Analyst, Global Macro