- AI-linked equities now closely track US yields and dollar
- Two-year and 10-year yields suffer historic daily declines
- Euro weakness masks broader selling pressure on US dollar
- Nasdaq support may determine the next major market move
From oil to AI sentiment
Markets have witnessed something of a changing of the guard in October, with the vice-like grip of crude oil fluctuations now seemingly replaced by AI sentiment. With evidence accumulating that the AI trade is being used as a proxy for the broader US economic exceptionalism story, it now appears to be playing a key role in driving US Treasury yields, Fed pricing and the US dollar.
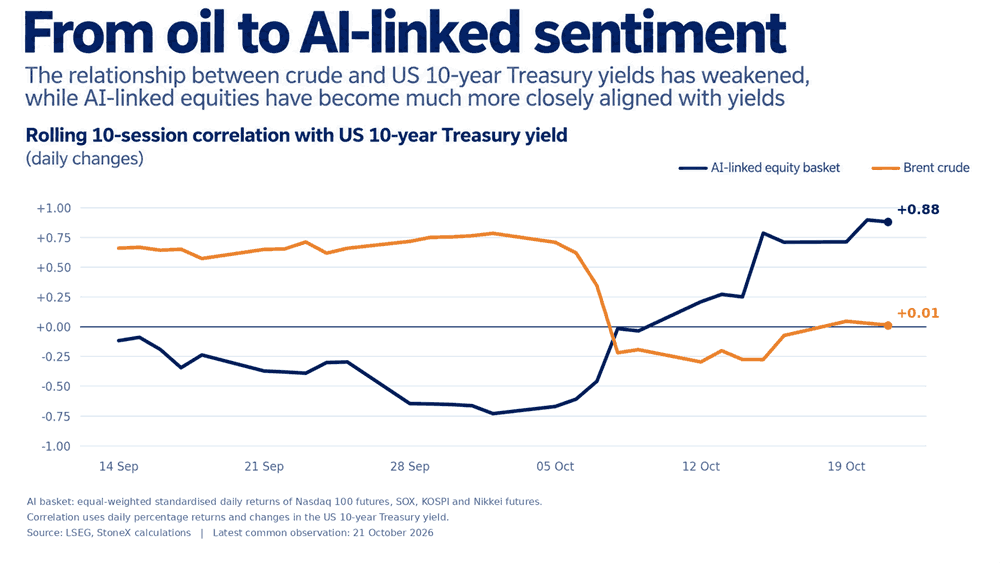
The abruptness of the shift has been nothing short of extraordinary, with the 10-session correlation between our basket of AI-linked equities, comprising Nasdaq 100 futures, the Philadelphia Semiconductor Index (SOX), KOSPI futures and Nikkei futures, and US 10-year Treasury yields surging to +0.88. Meanwhile, the once-strong positive relationship with Brent crude has collapsed to almost zero, indicating no meaningful correlation over the same period.
Source: LSEG
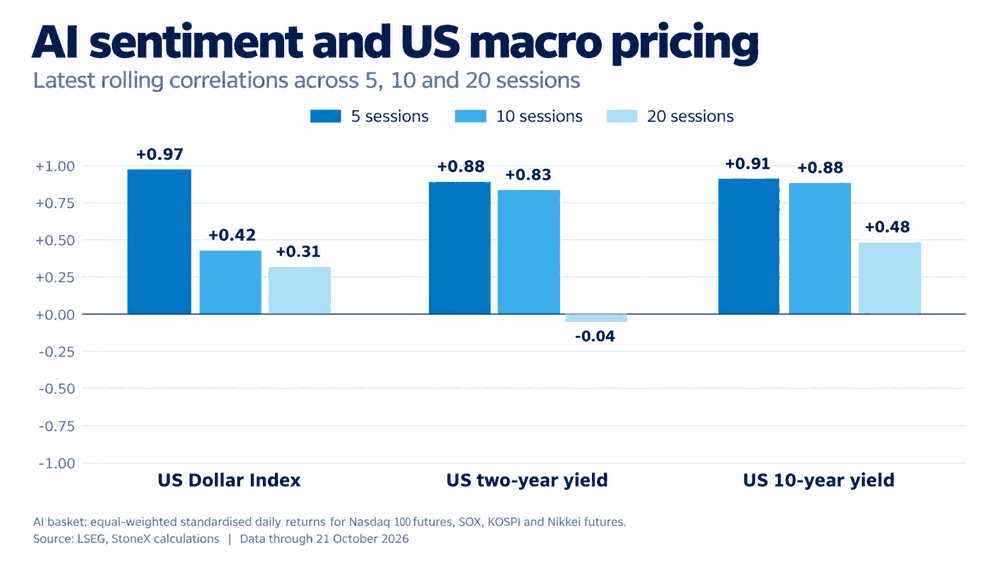
And it's not just Treasury yields moving alongside AI-linked equities. Over the past five sessions, the correlation between our AI basket and the US Dollar Index has reached +0.97, with similarly strong positive relationships against US two-year and 10-year yields at +0.88 and +0.91 respectively. While we need to be cautious about reading too much into correlations over such a short window, combined with the evidence elsewhere, AI sentiment now appears to be the overriding macro driver of movements across broader markets.
Source: LSEG
The shift is also reflected in Fed interest rate expectations. In mid-September, markets were pricing more than 100 basis points of additional tightening through the end of 2027. That has since fallen to around 61 basis points, including a 22 basis point unwind on Thursday alone, as concerns surrounding the AI trade have intensified.
Nasdaq rout sparks huge Treasury rally
That dramatic unwind in hawkish Fed pricing has been accompanied by an equally extraordinary rally further out along the Treasury curve, as Thursday's rout in technology stocks demonstrated. The Nasdaq 100 index slumped 3.08%, while the Nasdaq Volatility Index (VXN) surged 4.30 points to 28.72, as selling in technology stocks coincided with an enormous rally in US Treasury futures.
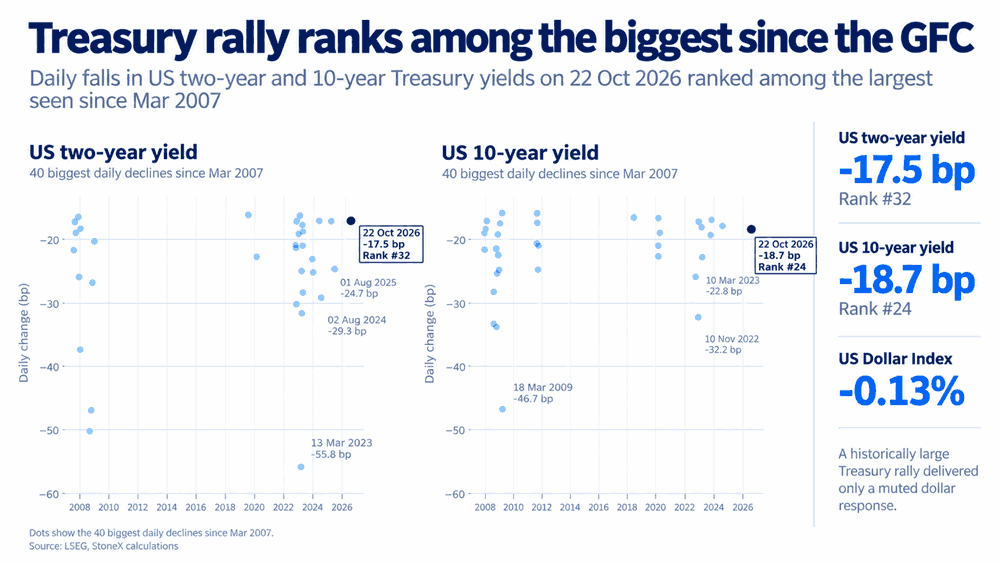
The scale of the move in yields was almost unprecedented outside periods of extreme market stress. The US two-year yield plunged 17.49 basis points, while the 10-year yield tumbled 18.69 basis points, ranking as their 32nd- and 24th-largest daily declines, respectively, since March 2007. As the graphic below demonstrates, many of the larger moves occurred during the most extreme periods of market turmoil, including the GFC, the pandemic and the US regional banking crisis in March 2023 involving Silicon Valley Bank.
Source: LSEG
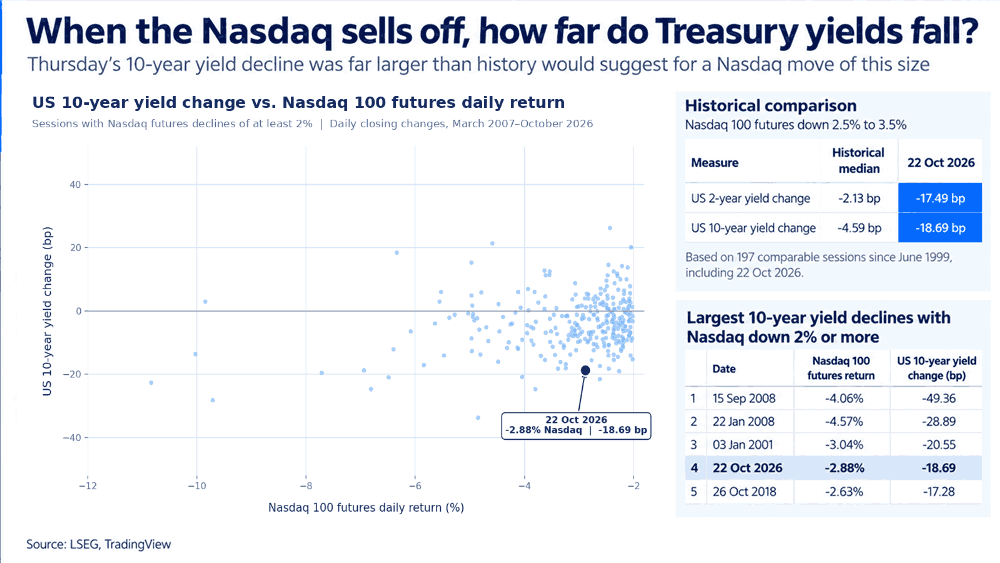
What's even more notable about Thursday's move is just how aggressively Treasuries rallied relative to the size of the equity market drawdown. Looking at sessions since March 2007 when Nasdaq 100 futures declined between 2.5% and 3.5%, the median fall in US 10-year yields was just 5.4 basis points. Thursday's 18.69 basis point decline was nearly three and a half times larger, ranking as the third-largest among comparable sessions over that period.
Source: LSEG
Nasdaq support could hold the key for broader markets
If AI sentiment really is driving the bus, the near-term direction of US Treasury yields and the dollar may rest with what happens next in the Nasdaq 100. Given the broader relationship we've identified between AI-linked equities and US macro markets, Friday's Asian session could also be particularly revealing, with the KOSPI and Nikkei worth watching closely for clues as to whether Thursday's technology rout will extend into the weekend.
Source: TradingView
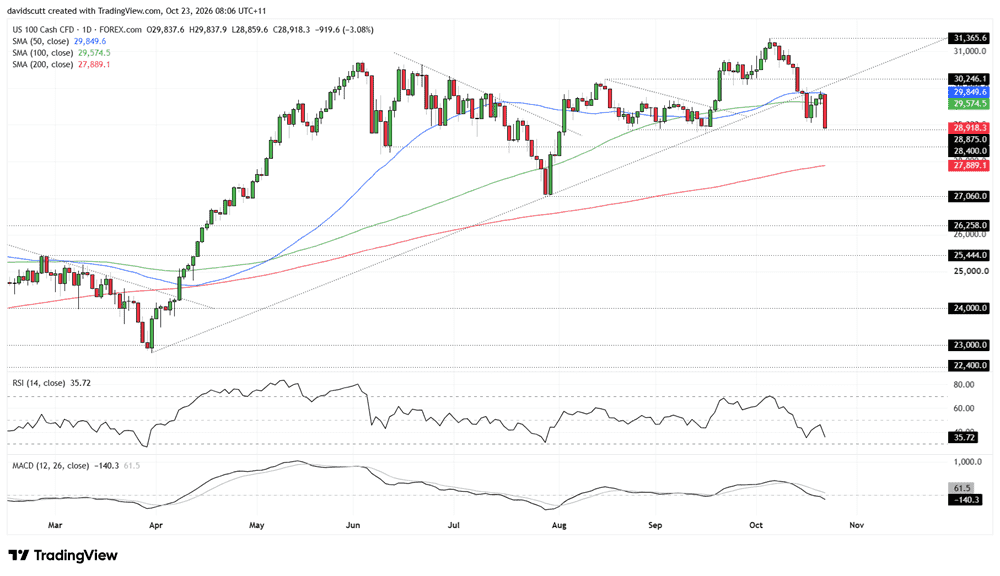
Despite the scale of Thursday's sell-off, our Nasdaq 100 contract remains just above support at 28,875, a level that has attracted bids on multiple occasions dating back to late August. It now looms as the key downside level to watch, not just for the index, but potentially for Treasury yields and the US dollar as well.
The fleeting bounce heading into Thursday's rout now appears to have been little more than a dead cat bounce, with the recovery stopped in its tracks at the 50-day moving average, making that the first level to watch overhead. Given the abruptness and intensity of the latest selling, the path of least resistance still appears to favour the downside, particularly heading into next week's major earnings releases from other AI hyperscalers.
Below 28,875, the next level to watch is 28,400, which has repeatedly acted as both support and resistance. It's a messy level, with the price often trading through it before snapping back, but remains important nonetheless. Further down, the 200-day moving average at 27,889 comes into view. A break beneath that, following the already confirmed breach of the uptrend running from the April lows, would bolster the case for a broader trend change, bringing the July swing low at 27,060 into focus, followed by 26,258, a major level that previously acted as resistance in late 2025 and early 2026.
The oscillators continue to favour shorts over longs, with RSI (14) moving back towards the low seen earlier this month, although it is not yet oversold. MACD reinforces the message, having recorded a bearish crossover and turned negative. Downside momentum appears to be rebuilding, adding to the risk of a break beneath support.
Euro weakness masks pressure on the US dollar
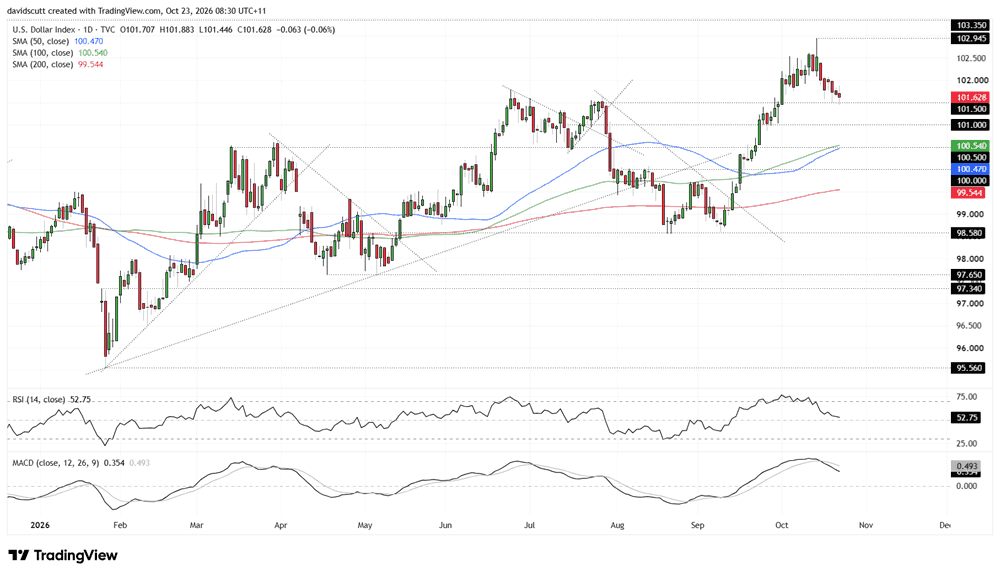
Despite the enormous rally in US Treasuries on Thursday, the US Dollar Index continues to hold horizontal support at 101.50, a level where the price stalled on several occasions earlier this year.
Ordinarily, such a sharp decline in US yields would be expected to weigh more heavily on the dollar. And that was certainly the case against the Japanese yen, with USD/JPY falling around 0.84%, broadly in line with what historical relationships with US Treasury yields and yield differentials would suggest.
Some may argue that the dollar's relative resilience reflects its traditional safe-haven appeal during periods of market stress. But with evidence accumulating that AI sentiment is being used as a proxy for the broader US economic outlook, I'm not convinced safe-haven demand is the main reason the dollar has held up despite the collapse in US yields and relative interest rate differentials.
Instead, the euro's own problems appear to offer a far more plausible explanation, with concerns surrounding France's fiscal position continuing to weigh on its sovereign debt market. French government bond yields blew out relative to German Bunds again on Thursday, leaving the common currency struggling to capitalise on the sharp decline in US yields.
Given the euro's significant weighting in DXY, its continued underperformance may be preventing a much larger decline in the index, even as the yen strengthens and US yields tumble.
Source: TradingView
If Nasdaq support at 28,875 gives way, a subsequent break beneath 101.50 in DXY could follow, putting 101.00 and then the confluence of the 50-day and 100-day moving averages with horizontal support around 100.50 into focus. That looms as a key support zone for the index. Should it also break, 100.00 and then the 200-day moving average would be the next levels to watch, followed by 98.58, where DXY bottomed on several occasions in August and September this year.
The oscillators are more neutral, although they're providing a warning to the bulls that the upside momentum evident throughout much of September and into early October has now completely dissipated, leaving directional risks more evenly balanced than previously.
On the topside, DXY struggled to sustain a move above 102.50 earlier this month, making that the first resistance level to watch, followed by 102.945, where a previous breakout attempt failed.