



NFP Preview: Could We See the First Sub-100K Jobs Report of 2025?
Leading indicators point to a below-expectations reading in this month’s NFP report, with headline job growth potentially coming in somewhere in the 75-125K range
Share this:

NFP Preview: Could We See the First Sub-100K Jobs Report of 2025?
NFP Key Points
- NFP report expectations: +120K jobs, +0.3% m/m earnings, unemployment at 4.3%
- Leading indicators point to a below-expectations reading in this month’s NFP report, with headline job growth potentially coming in somewhere in the 75-125K range
- The US Dollar Index (DXY) has fallen to 3+ year lows, potentially setting the stage for a bounce if we see more job growth than expected… though confirmation of a slowing labor market could still put a July rate cut on the table if CPI (July 15) also comes in weak
When is the June NFP Report?
The June NFP report will be released on Thursday, July 3, at 8:30 ET.
NFP Report Expectations
Traders and economists expect the NFP report to show that the US created 120K net new jobs, with average hourly earnings rising 0.3% m/m (3.9% y/y) and the U3 unemployment rate ticking up to 4.3%.
NFP Overview
If you’re watching the same metrics I am, the deterioration in the labor market is unmistakable.
In addition the classic U3 unemployment rate nearing its highest level in 2.5 years, we’ve also seen the first negative ADP reading since early 2023, a sustained uptick in initial unemployment claims, and persistently high continuing claims figures, signaling that while layoffs haven’t necessarily surged, it’s increasingly difficult for unemployed workers to secure a new job. In a twist on the “frog in boiling water” analogy, the jobs market is more like my daughter in the bathtub: blissfully unaware as the once-hot water gradually cools…until she’s suddenly shivering and begging for a towel, just as the Fed may soon need to cut rates to rescue a chilling labor market.
When it comes to this month’s jobs report, expectations are for +120K jobs, with the unemployment rate expected to tick up to 4.3%. One key area to watch will be the average hourly earnings measure, which is expected to come in at 0.3% m/m, down a tick from last month’s reading.

Source: StoneX
Crucially, traders now expect about two-and-a-half 25bps rate cuts from the Federal Reserve this year, though many traders still think Jerome Powell and Company are likely to hold steady at this month’s meeting.
NFP Forecast
As regular readers know, we focus on four historically reliable leading indicators to help handicap each month’s NFP report, but given the vagaries of the calendar this month, we only have three in advance:
- The ISM Manufacturing PMI Employment component fell slightly to 45.0 from last month’s 46.8 reading.
- The ADP Employment report fell by -33K jobs, down from last month’s downwardly revised 29K print.
- Finally, the 4-week moving average of initial unemployment claims ticked up to 244K from last month’s 235K reading.
Weighing the data and our internal models, the leading indicators point to a below-expectations reading in this month’s NFP report, with headline job growth potentially coming in somewhere in the 75-125K range, albeit with a big band of uncertainty given the current global backdrop.
Regardless, the month-to-month fluctuations in this report are notoriously difficult to predict, so we wouldn’t put too much stock into any forecasts (including ours). As always, the other aspects of the release, prominently including the closely-watched average hourly earnings figure which came in at 0.4% m/m in the most recent NFP report.
Potential NFP Market Reaction
|
|
Wages < 0.2% m/m |
Wages 0.2-0.4% m/m |
Wages > 0.4% m/m |
|
< 100K jobs |
Bearish USD |
Bearish USD |
Slightly Bearish USD |
|
100-140K jobs |
Slightly Bearish USD |
Neutral USD |
Neutral USD |
|
> 140K jobs |
Slightly Bullish USD |
Slightly Bullish USD |
Bullish USD |
As I outline below, the US Dollar Index (DXY) has fallen to 3+ year lows, potentially setting the stage for a bounce if we see more job growth than expected… though confirmation of a slowing labor market could still put a July rate cut on the table if CPI (July 15) also comes in weak.
US Dollar Technical Analysis – DXY Daily Chart
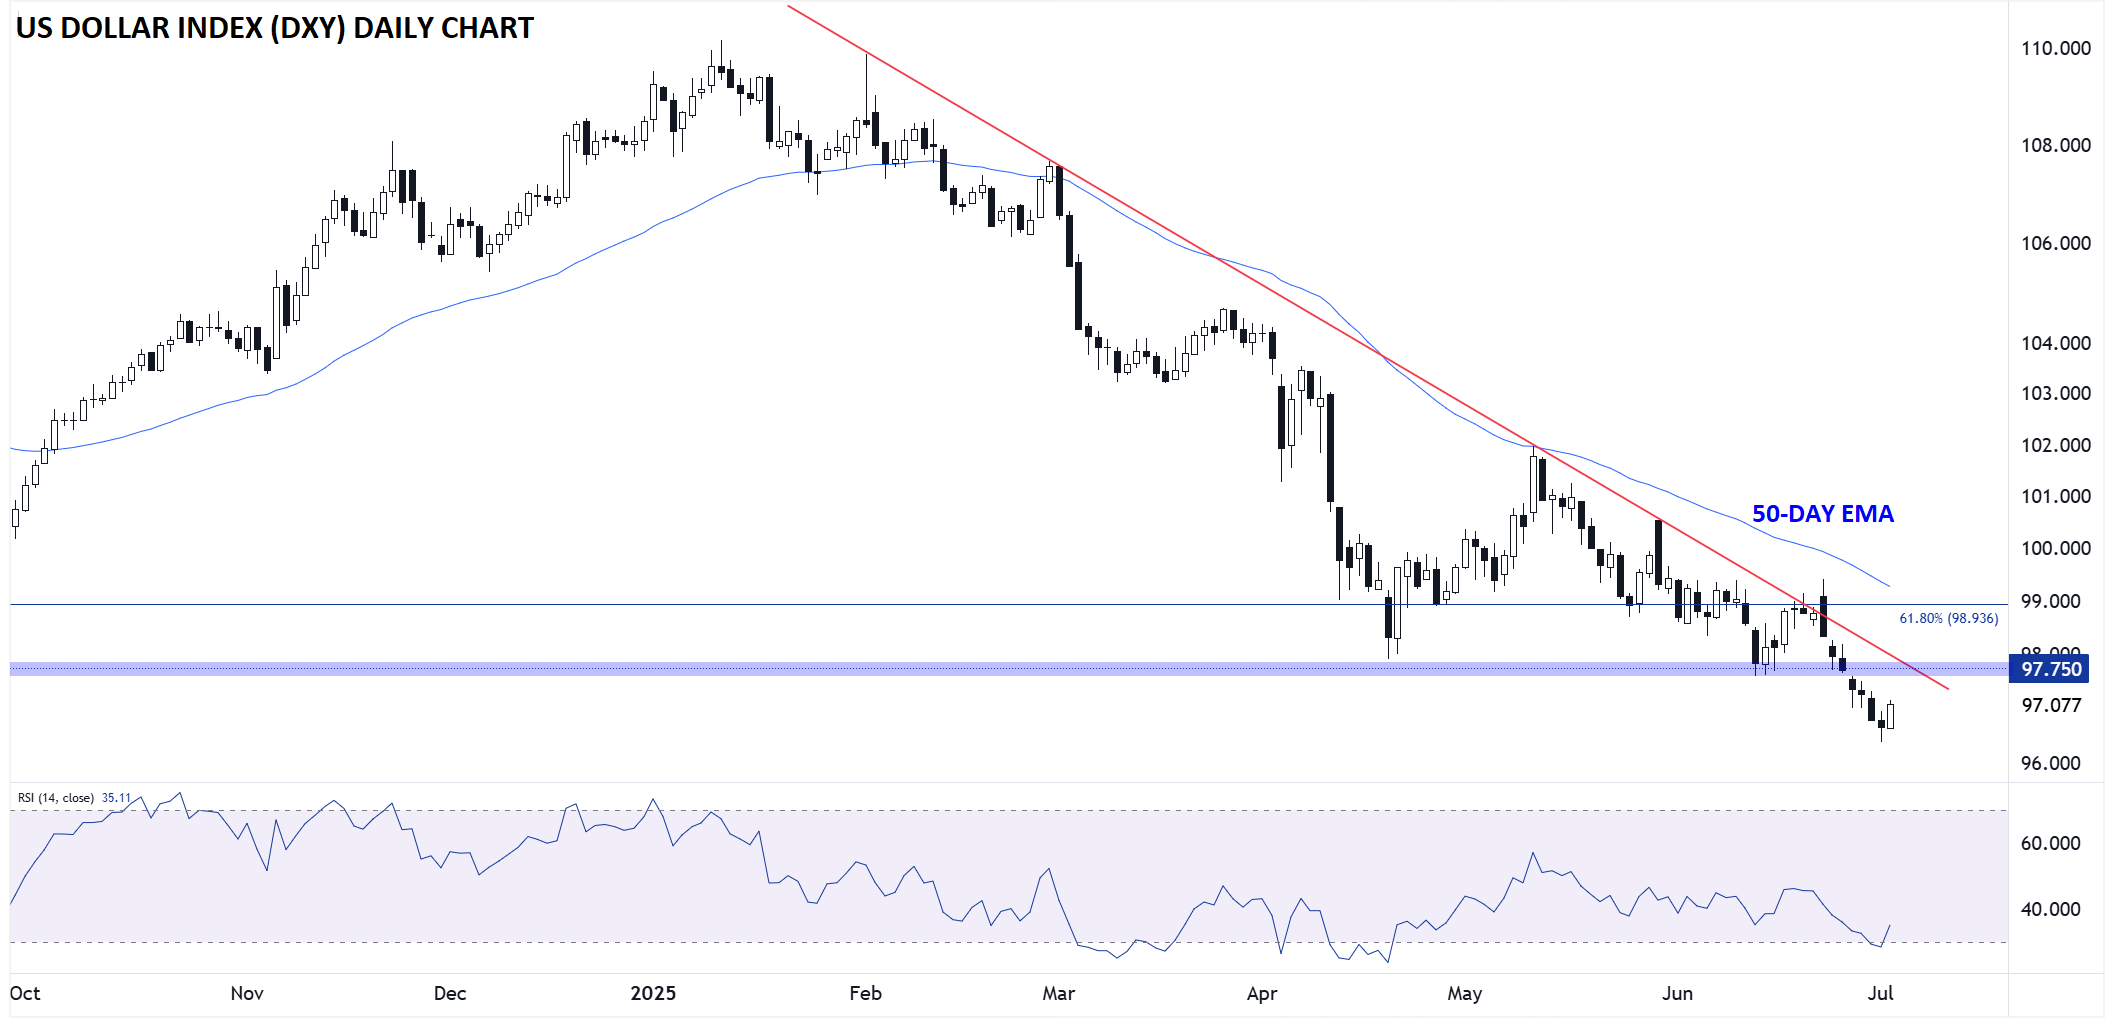
Source: TradingView, StoneX
As the chart above shows, the US Dollar Index (DXY) continues its 2025 downtrend unabated, hitting the lowest level since early 2022 amidst trade policy uncertainty and the aforementioned deterioration in the jobs market. From a technical perspective, the greenback is oversold, so there may be scope for a near-term bounce back toward previous-support-turned-resistance near the 97.75 level if the jobs report comes in better than expected heading into a long holiday weekend in the US.
That said, as long as DXY remains below that level (as well as bearish trend line resistance and the declining 50-day EMA), the long-term downtrend will remain intact and traders will be more likely to sell any near-term bounces rather than position for meaningful gains.
-- Written by Matt Weller, Global Head of Research
Follow Matt on Twitter: @MWellerFX
Latest market news




Open an account today
Experience award-winning platforms with fast and secure execution.
Economic calendar
Web Trader platform
Our sophisticated web-based platform is packed with features.
Related articles
Rates Shock, Metals Rout Leave Aussie Dollar Under the Pump
The global environment is becoming increasingly hostile for the Aussie. With AUD/USD breaking major support and AUD/JPY threatening further downside, today's jobs report faces an uphill battle to change the picture.


Euro Short-term Outlook: EUR/USD Plunges to 19-Month Low—Bears Face Critical Test 11 18 2026
The Euro selloff is now approaching pivotal support, raising the prospect of downside exhaustion as the November decline extends.


Japanese Yen Technical Outlook: USD/JPY Rally Stalls Near 160—Breakout Support in Focus 11 18 2026
USD/JPY has set its weekly range just above former resistance, with a range break likely to determine whether November’s rally has further to run.
From time to time, StoneX Financial Pty Ltd (“we”, “our”) website may contain links to other sites and/or resources provided by third parties. These links and/or resources are provided for your information only and we have no control over the contents of those materials, and in no way endorse their content. Any analysis, opinion, commentary or research-based material on our website is for information and educational purposes only and is not, in any circumstances, intended to be an offer, recommendation or solicitation to buy or sell. You should always seek independent advice as to your suitability to speculate in any related markets and your ability to assume the associated risks, if you are at all unsure. No representation or warranty is made, express or implied, that the materials on our website are complete or accurate. We are not under any obligation to update any such material.
As such, we (and/or our associated companies) will not be responsible or liable for any loss or damage incurred by you or any third party arising out of, or in connection with, any use of the information on our website (other than with regards to any duty or liability that we are unable to limit or exclude by law or under the applicable regulatory system) and any such liability is hereby expressly disclaimed.