


Over the last two trading sessions, the price of WTI crude has modestly recovered around 1.5%, as a new buying bias has started to emerge, mainly after recent comments from OPEC+ over the weekend suggesting that an oversupply scenario may not materialize in the coming months. As long as this moderate supply outlook holds, concerns about potential overproduction could continue to ease, supporting a stronger buying pressure around WTI’s short-term movements.

OPEC+ Comments
The latest meeting of the world’s most influential oil producers took place on October 5, where the group agreed to a moderate production increase for November — an addition of 137,000 barrels per day, well below previous forecasts that pointed to an increase of up to half a million barrels per day.
This decision surprised markets, as a larger output hike had been expected heading into the end of the year. However, OPEC+ emphasized its intention to maintain cautious adjustments to avoid market saturation in the short term, highlighting its commitment to oil market stability.
The organization also noted that a steady decline in demand could be expected during the final quarter of the year, which limits room for additional production increases until the group can better assess global consumption trends toward year-end.
Recent data from September showed that U.S. oil consumption — one of the world’s largest — fell to around 20 million barrels per day, aligning with OPEC+’s view of weaker demand. Over time, this trend could weigh on future production increases if demand continues to slow.
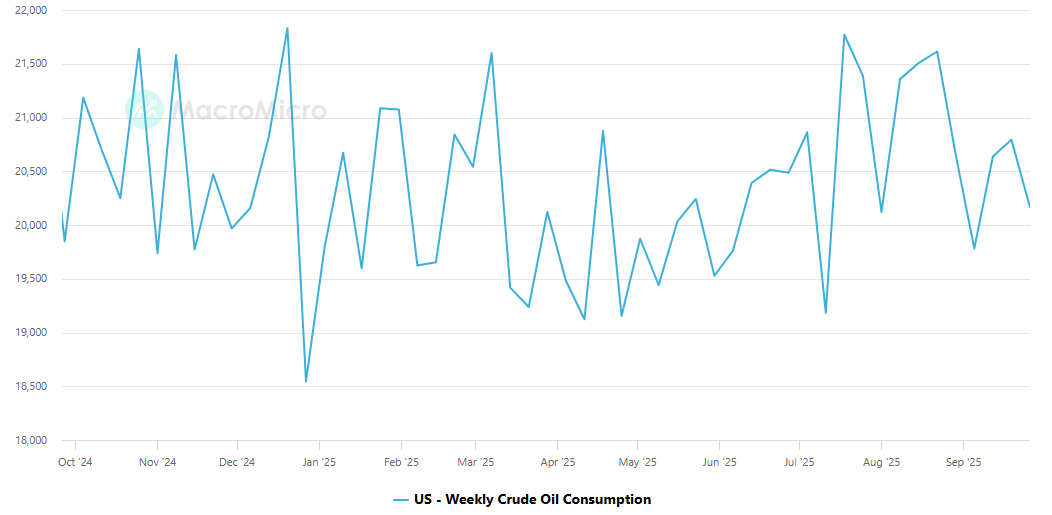
Source: Macro Micro
In this context, the easing of oversupply fears, together with OPEC+’s cautious stance, could support a steady buying pressure in the short term and boost WTI movements. However, if demand falls more than expected — as seen recently in the U.S. — the effect could be counterproductive, potentially disrupting the balance between supply and demand and creating a situation of excess supply against weak demand. This could fuel market fear around crude oil and revive selling pressure seen in prior weeks.
What About Oil Market Confidence?
The CBOE OVX Index has been rising in recent weeks, now approaching the 40-point level, signaling a steady increase in implied volatility for crude oil. This suggests growing uncertainty about the future of oil prices and a higher likelihood of sharp short-term price swings.

Source: CBOE
In this environment, the continued rise in OVX can be seen as a sign of market distrust, as heightened volatility may trigger rapid declines in crude prices. As long as markets do not expect price stability in oil, the OVX is likely to remain elevated, reinforcing the perception of crude as a risk asset. This could weigh on short-term demand and strengthen a temporary bearish bias in the market.
WTI Technical Outlook
Source: StoneX, Tradingview
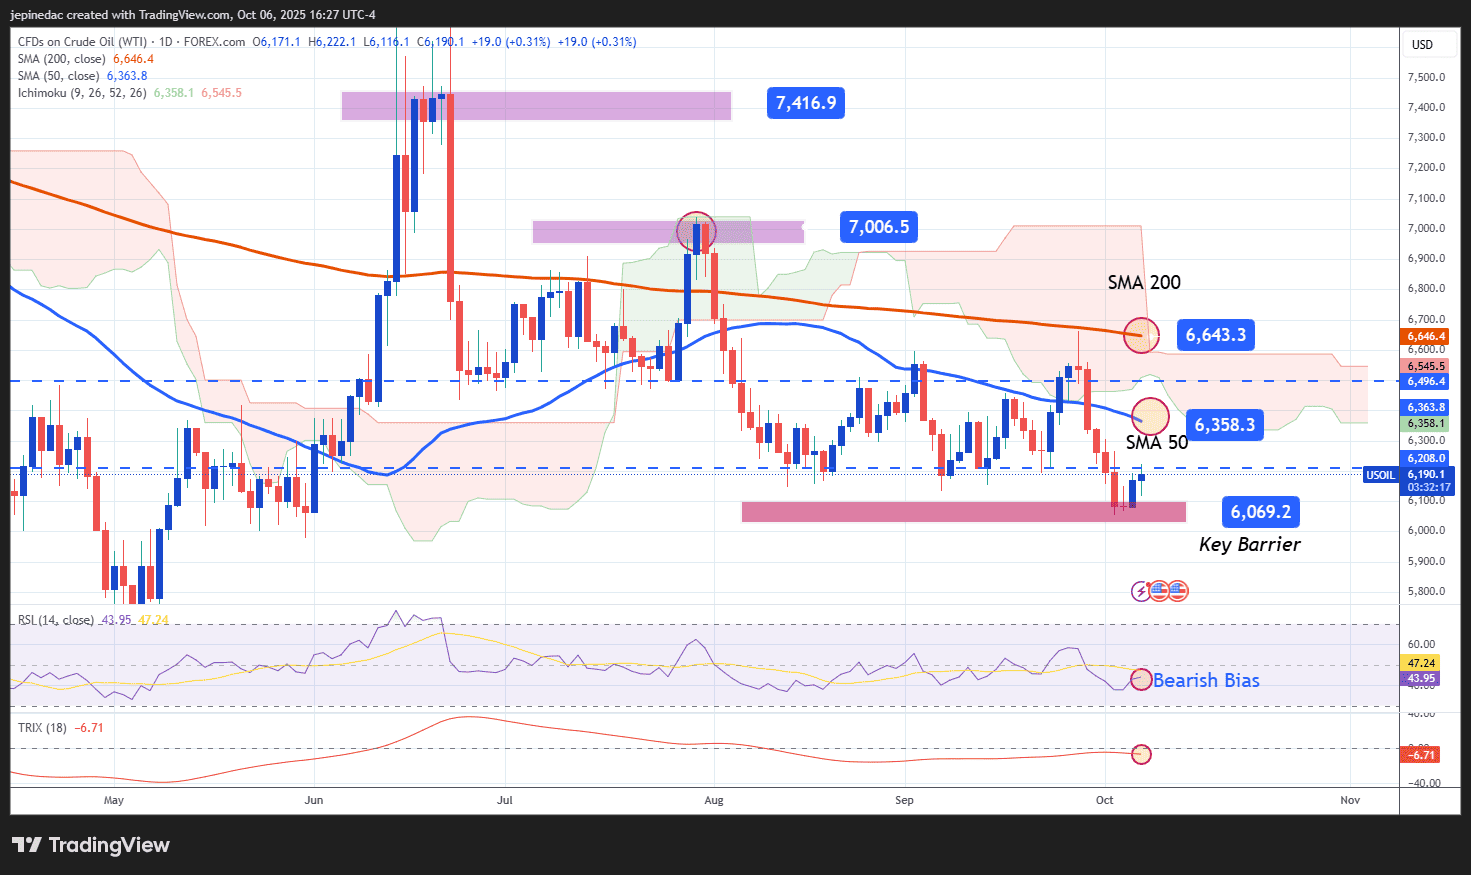
- Selling momentum on hold: During the final days of September, a strong selling impulse pushed WTI prices down to support levels not seen since May. However, prices have since shown a notable rebound, temporarily halting that downward move. If selling pressure fails to regain strength, a neutral market structure could develop in the short term.
- RSI: The RSI line continues to oscillate below the central 50 level, suggesting a dominant bearish bias based on the average of the last 14 trading sessions. Still, the indicator’s recent positive slope could hint at a gradual shift toward neutrality in price behavior.
- TRIX: On a broader view, the TRIX indicator remains below zero, confirming that the medium-term trend is still in bearish territory. Nevertheless, with the line nearing the zero level, a potential neutral shift could emerge as moving averages begin to converge.
Key Levels:
- 66 USD – Major Resistance: Aligns with the 200-period simple moving average, serving as the most important barrier for buyers. A decisive breakout above this level could signal a stronger bullish structure ahead.
- 63 USD – Near-Term Resistance: Corresponds to the 50-period simple moving average. Price action around this zone could reflect indecision, leading to sideways consolidation in the coming sessions.
- 60 USD – Key Support: This is the most relevant psychological level on the chart. Any sustained move below it could trigger a fresh bearish trend in the upcoming sessions.
Written by Julian Pineda, CFA – Market Analyst
Follow him on: @julianpineda25




