Price leads and narrative follows, and at this point the US Dollar is holding support at prior resistance ahead of a pivotal FOMC meeting tomorrow. While there’s practically no expectation for any actual adjustments to rates there’s still considerable odds for a move by the end of this year, which means the focus will largely be on the bank’s projections and guidance along with the press conference at 2PM ET.
For tomorrow, there’s a greater than 99% chance of no change to interest rates. Later in the year, however, there’s a 69.6% probability of the Fed cutting at least once by the end of 2026 and a 28.7% chance of at least two rate cuts.
CME Fedwatch Expectations for March FOMC Meeting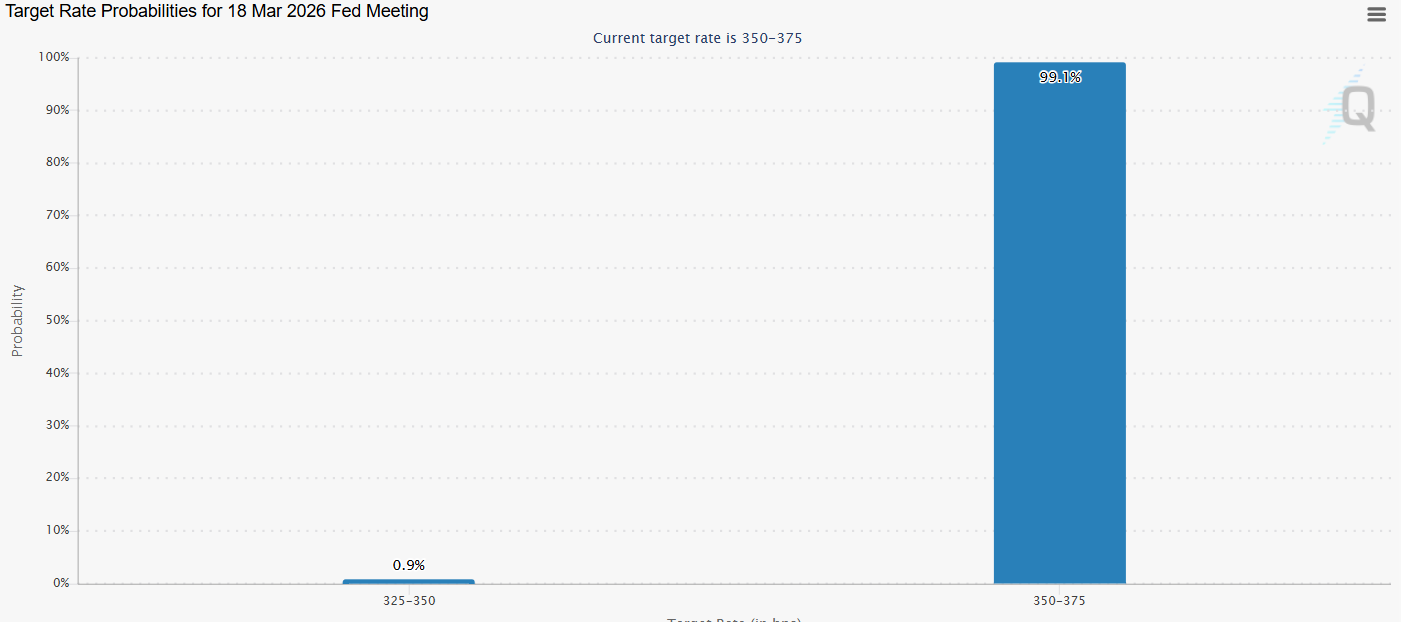
Chart prepared by James Stanley; data derived from Tradingview
I looked into the DXY backdrop on Friday and at the time the USD was in deep overbought territory after setting a fresh 2026 high. But, as I said then, it was only in late-January when we had the mirror image of that situation with a deep oversold USD, and for those chasing those extreme moves it did not work out well. Instead, wait for the pullback and see how traders respond. In the late-January oversold episode, resistance held at an ideal place – but sellers were unable to stretch down to fresh lows, leading to the ascending triangle building in February that, eventually, led to the March breakout.
Now – we have a deep overbought read that showed on Friday and that so far has pulled back, and we’ve seen a spot of support come into play at prior resistance from 99.48-99.68.
US Dollar Four-Hour Price Chart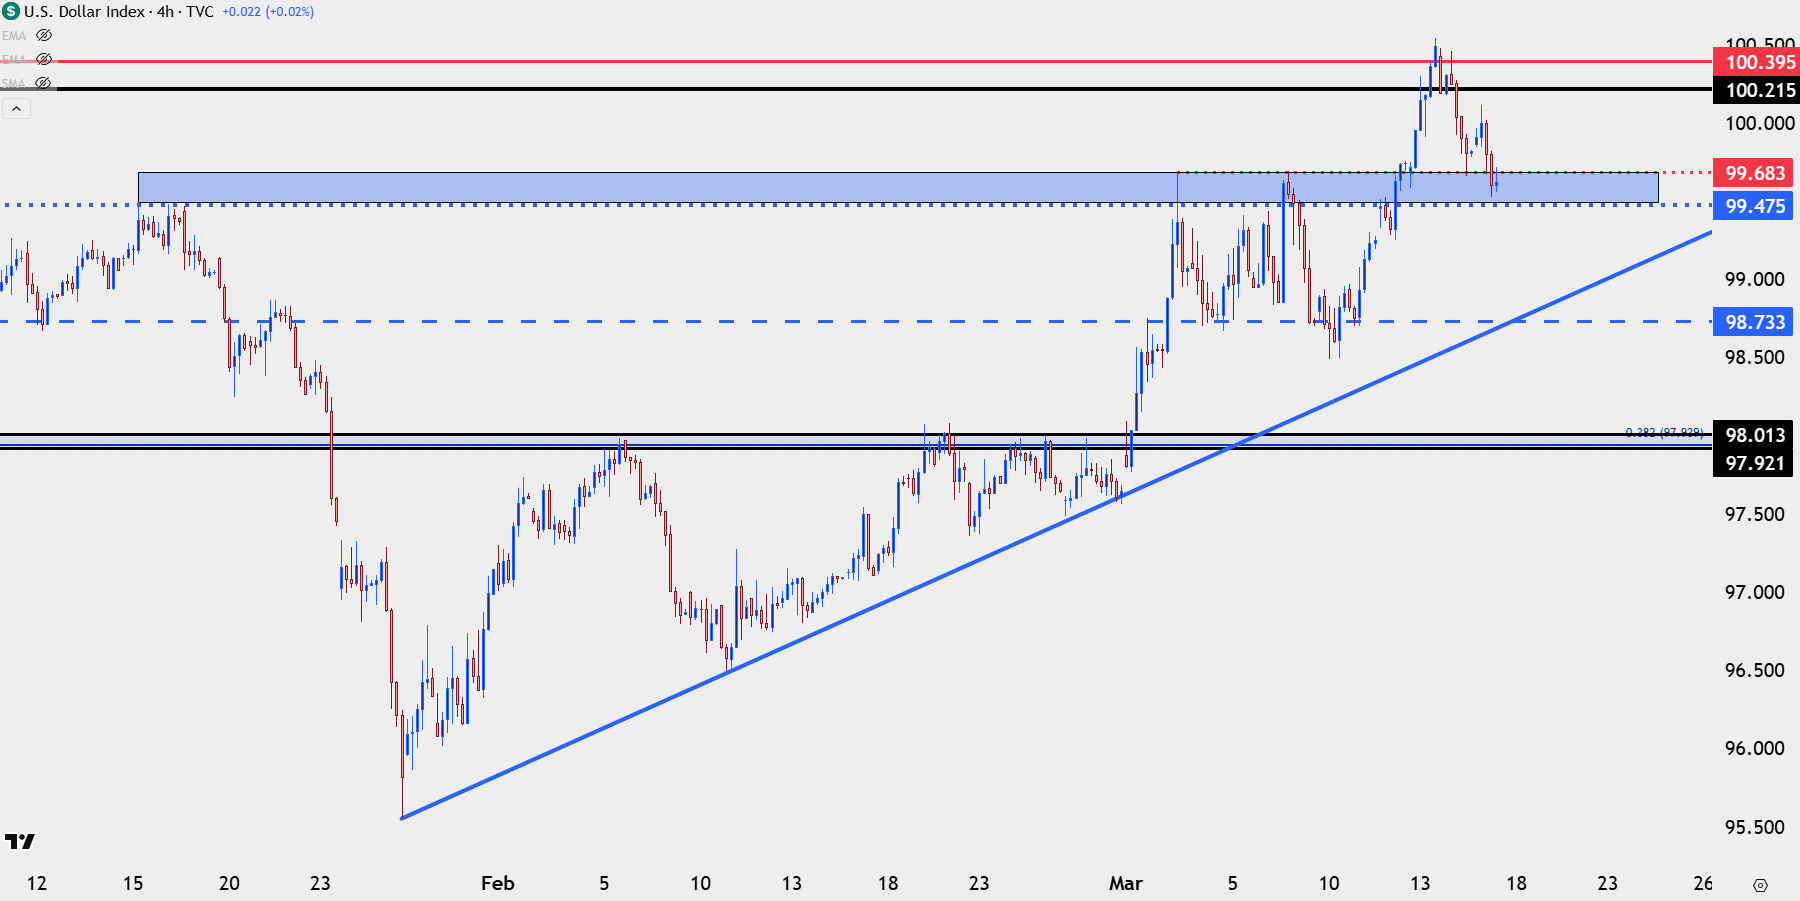
Chart prepared by James Stanley; data derived from Tradingview
Bulls in Control into FOMC
From the daily chart we can see that there’s still a justified case for another ascending triangle, as buyers have pushed higher lows in brisk fashion to go along with continued resistance around the 100.40 area that bulls haven’t been able to leave behind.
Given the link with oil combined with tomorrow’s FOMC meeting, there’s certainly potential for ‘new’ themes to price in as the oil correlation has been rather tight of late, and it doesn’t seem as though the Fed is in position to sound too dovish given Friday’s Core PCE read of 3.1%.
For USD-weakness, it seems we would need some type of move out of Japan to try to push the USD/JPY pair further away from the 160.00 level, perhaps even after a test above the big figure. Given how important that carry trade has been to larger FX dynamics I think it’s reasonable that USD/JPY could be a push point for DXY reversal themes, but outside of that, it would seem the long side of the Dollar basket is positively correlated with continued tension in the Middle East which has a flow-through effect on inflation expectations, and inflation has already been high even before factoring in how higher oil prices will impact US economic dynamics.
US Dollar Daily Chart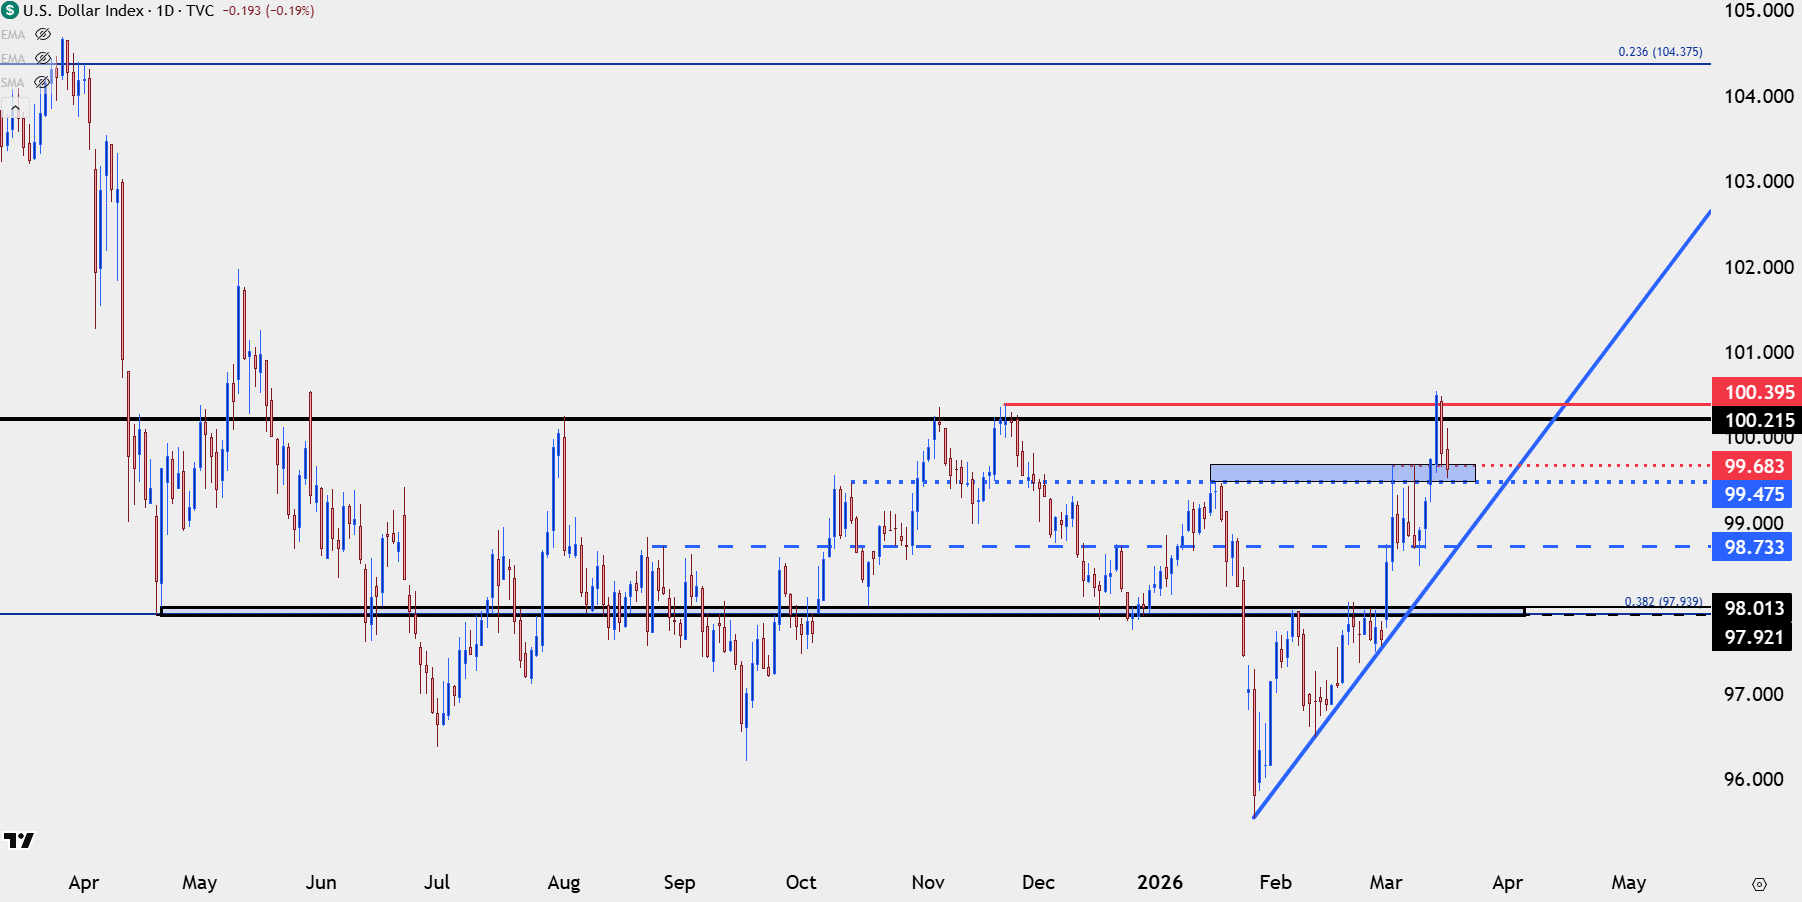
Chart prepared by James Stanley; data derived from Tradingview
EUR/USD
It was the harsh breakdown in the Euro that helped to drive that DXY breakout as USD/JPY had its own complications in carrying the weight given the proximity to the 160.00 level. But, the backdrop around EUR/USD helps to set up a clean mirror image dynamic of the late-January backdrop, as the pair had pushed into its most overbought in years while testing above the 1.2000 level, in a trend that’s unraveled in the month-and-a-half since.
That sell-off pushed into oversold territory last week on the pair first push below 1.1500 since November, and like I cautioned on the other side in January, those looking to sell should exercise some patience to wait for a pullback to see if bear defended the move.
So far, they haven’t, as price grinded above 1.1500 and on a short-term and is continuing to show higher-highs and lows on the hourly chart below.
EUR/USD Hourly Chart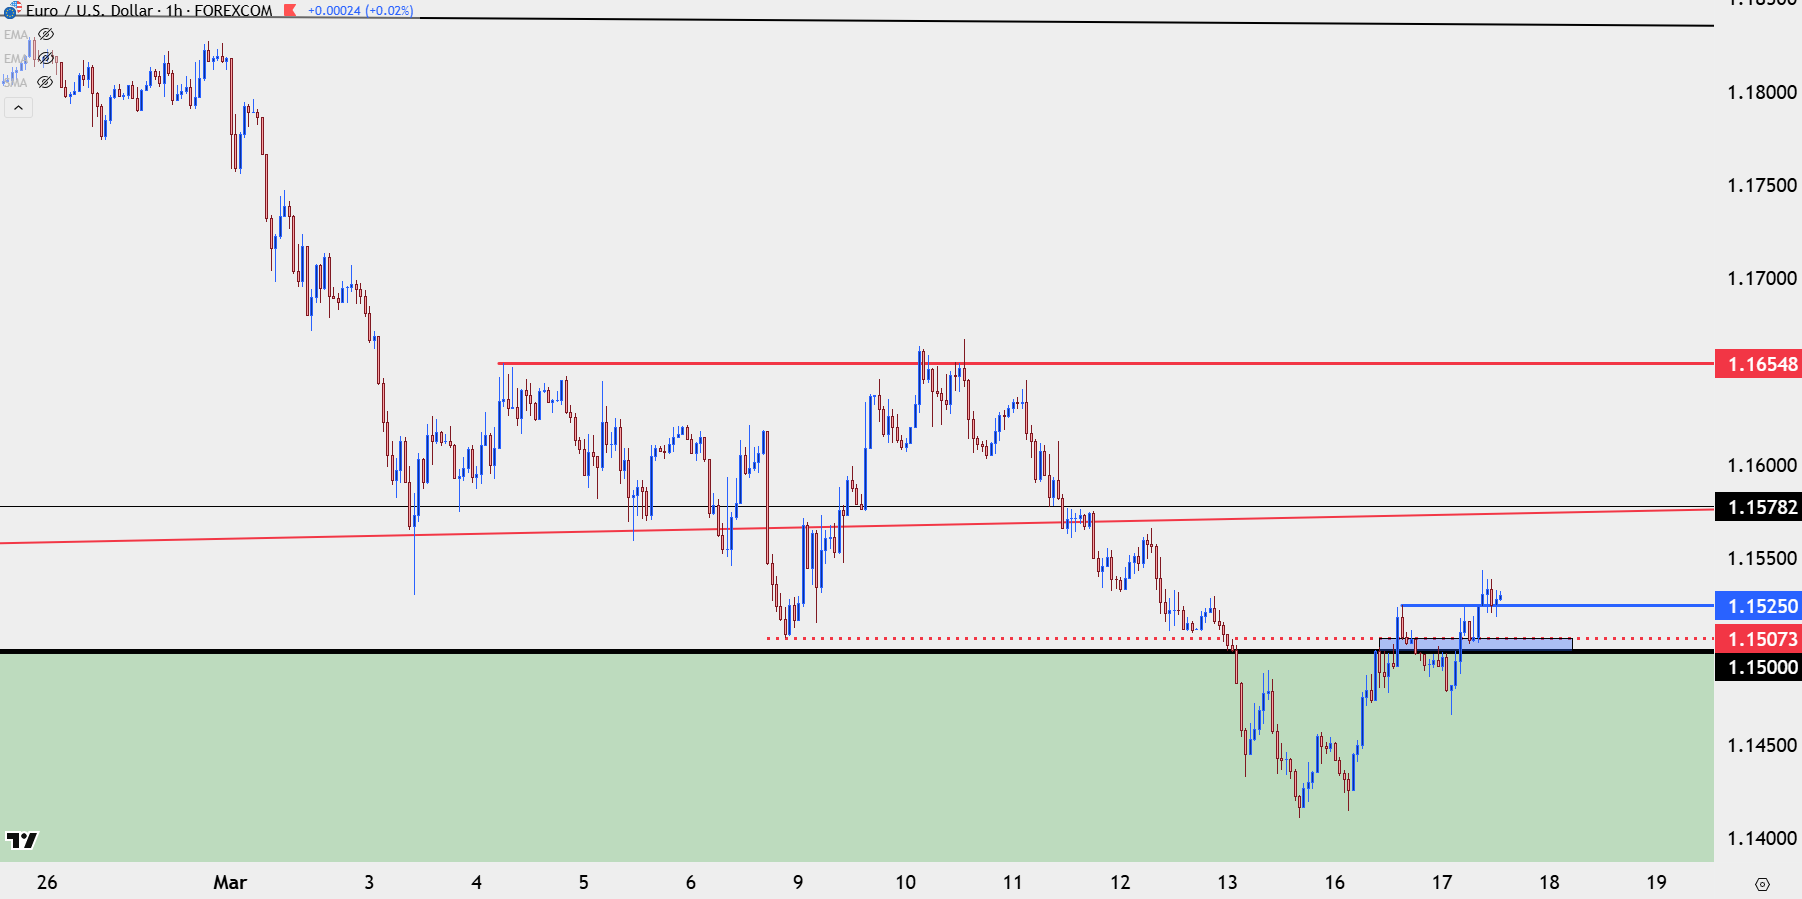
Chart prepared by James Stanley; data derived from Tradingview

EUR/USD Four-Hour
If you’re a EUR/USD bear, it’s the 1.1578 and 1.1655 levels that are of interest into tomorrow’s FOMC meeting. Each represents an area for sellers to show their hand if they do want to continue the downtrend that was so entrenched last week.
If you’re a EUR/USD bull, it’s the shorter-term setup you’d likely want to focus on, looking for that sequencing of higher-highs and lows on the hourly chart to push into a test of 1.1578 and then 1.1655.
EUR/USD Four-Hour Chart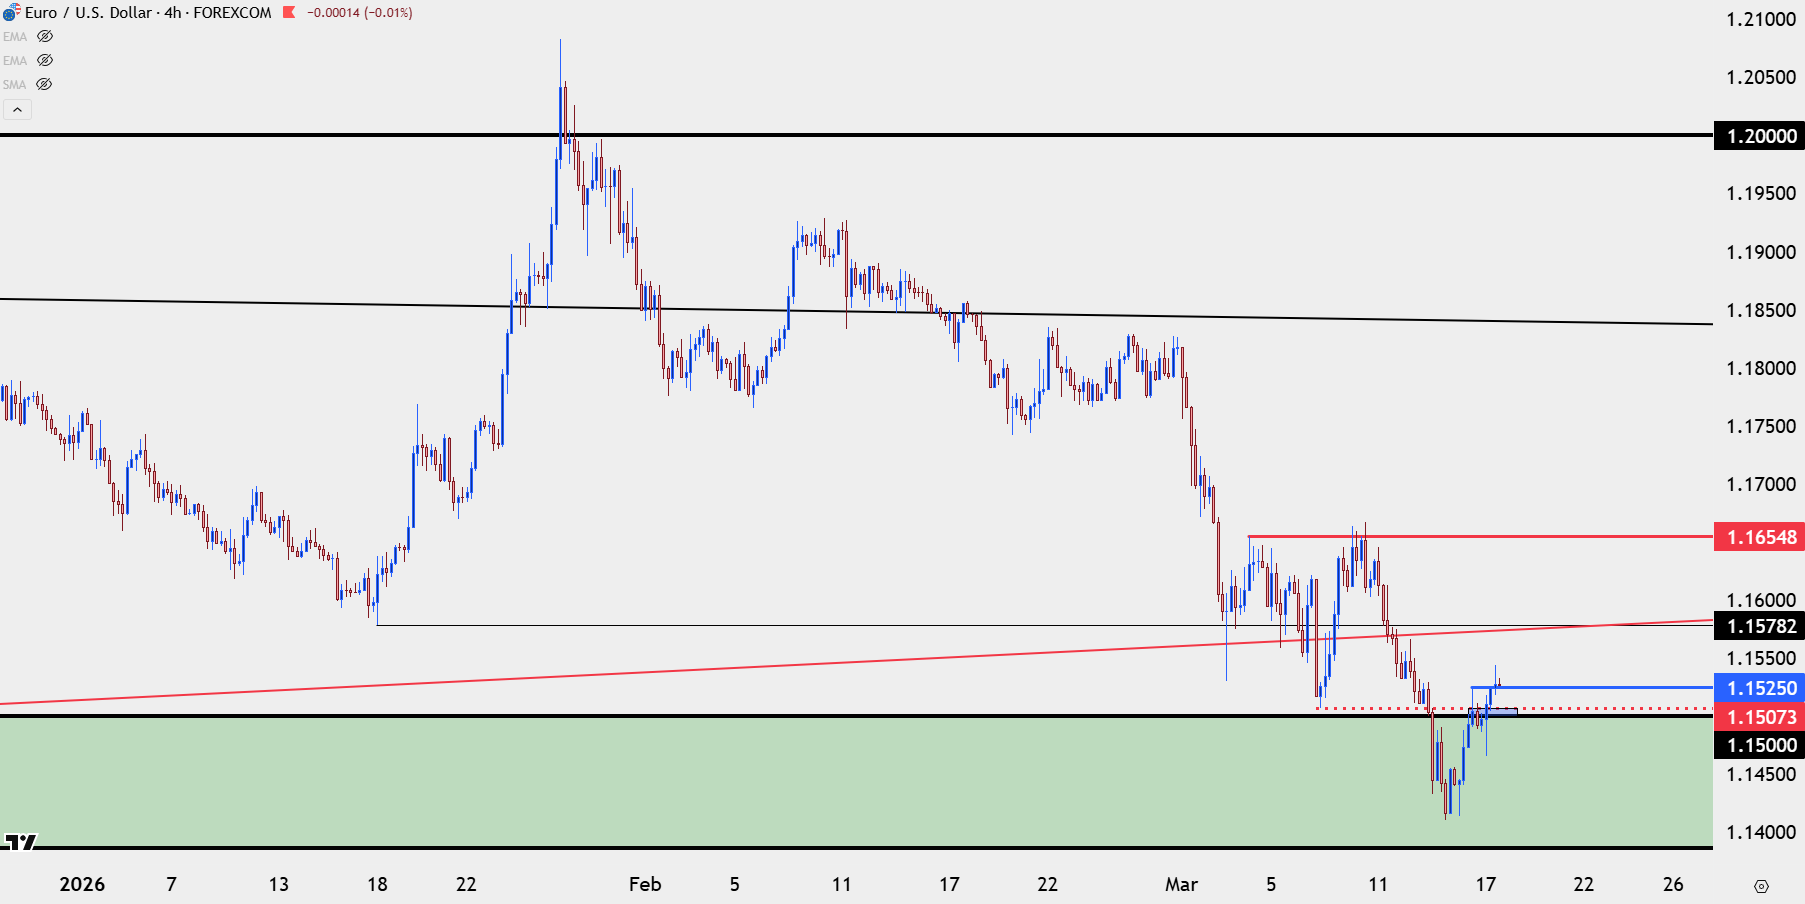
Chart prepared by James Stanley; data derived from Tradingview
GBP/USD
I like Cable a touch better for USD-weakness scenarios and the contrast with EUR/USD is clear given that the daily chart of GBP/USD did not go into oversold territory last week as Sterling remained slightly stronger than the Euro.
That said, we have to call this what it is in that it’s been lower-lows and highs here on the four-hour as well, and for that sequence to break, bulls are going to need to put in an effort above the 1.3390-1.3414 zone.
GBP/USD Four-Hour Chart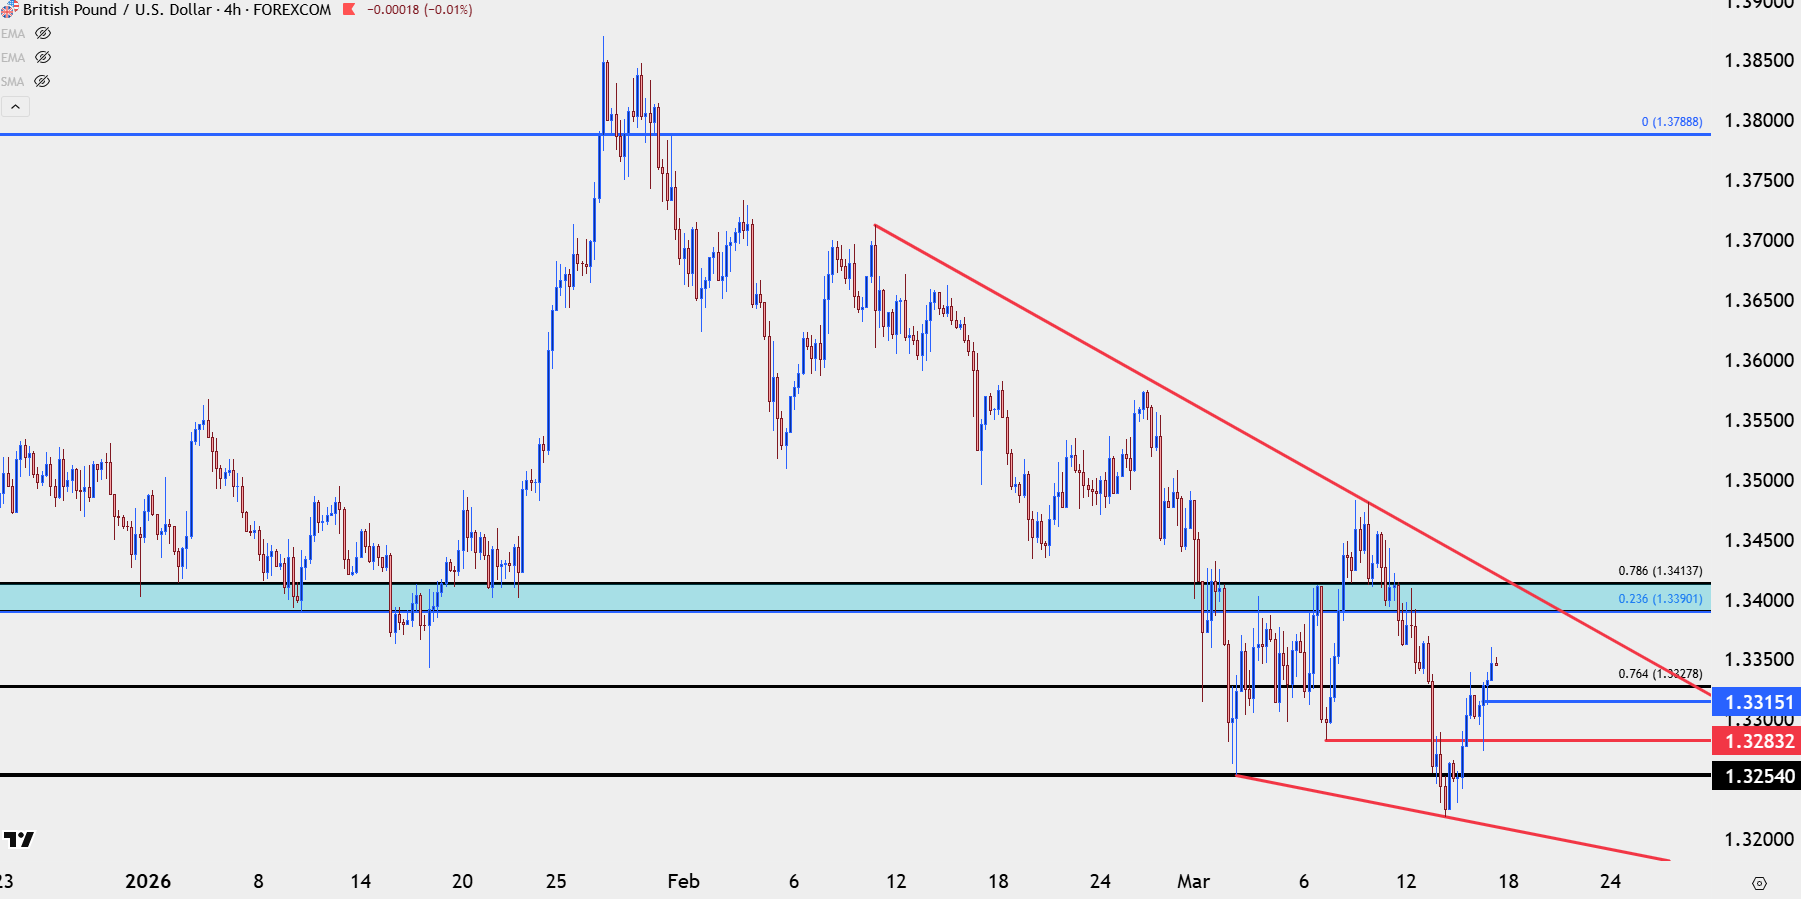
Chart prepared by James Stanley; data derived from Tradingview

USD/JPY
So the trend in USD/JPY has remained incredibly consistent over the past month and this has been one of my favored bullish USD setups. Price is price and at this point I’m still looking at this as bullish, but the question I have as we go into a really big week is whether the BoJ is standing by to make a splash if or when the 160.00 level comes into play.
It seems both the US and Japan would like to see the spot rate lower and with a FOMC meeting tomorrow widely expected to bring higher inflation projections (and possibly lessened rate cut expectations in response) along with the impact of higher oil prices on Japanese inflation, I think it’s reasonable to imagine that the BoJ and MoF are coming into the week with a contingency plan for what happens if the 160.00 level trades.
It’s not an automatic fade above that price, either, as we saw in 2022 with the 145 episode, but chasing breakouts into 160.00 could be treacherous. So, for bulls, it’s either playing the pullback or waiting for the break in order to play a shorter-term pullback.
If sellers do make a statement move, that’s something that could reasonably drive USD-weakness given how built in that carry trade has become. And I think USD/JPY closer to 155.00 might be pleasing to policymakers in both the US and Japan.
USD/JPY Four-Hour Chart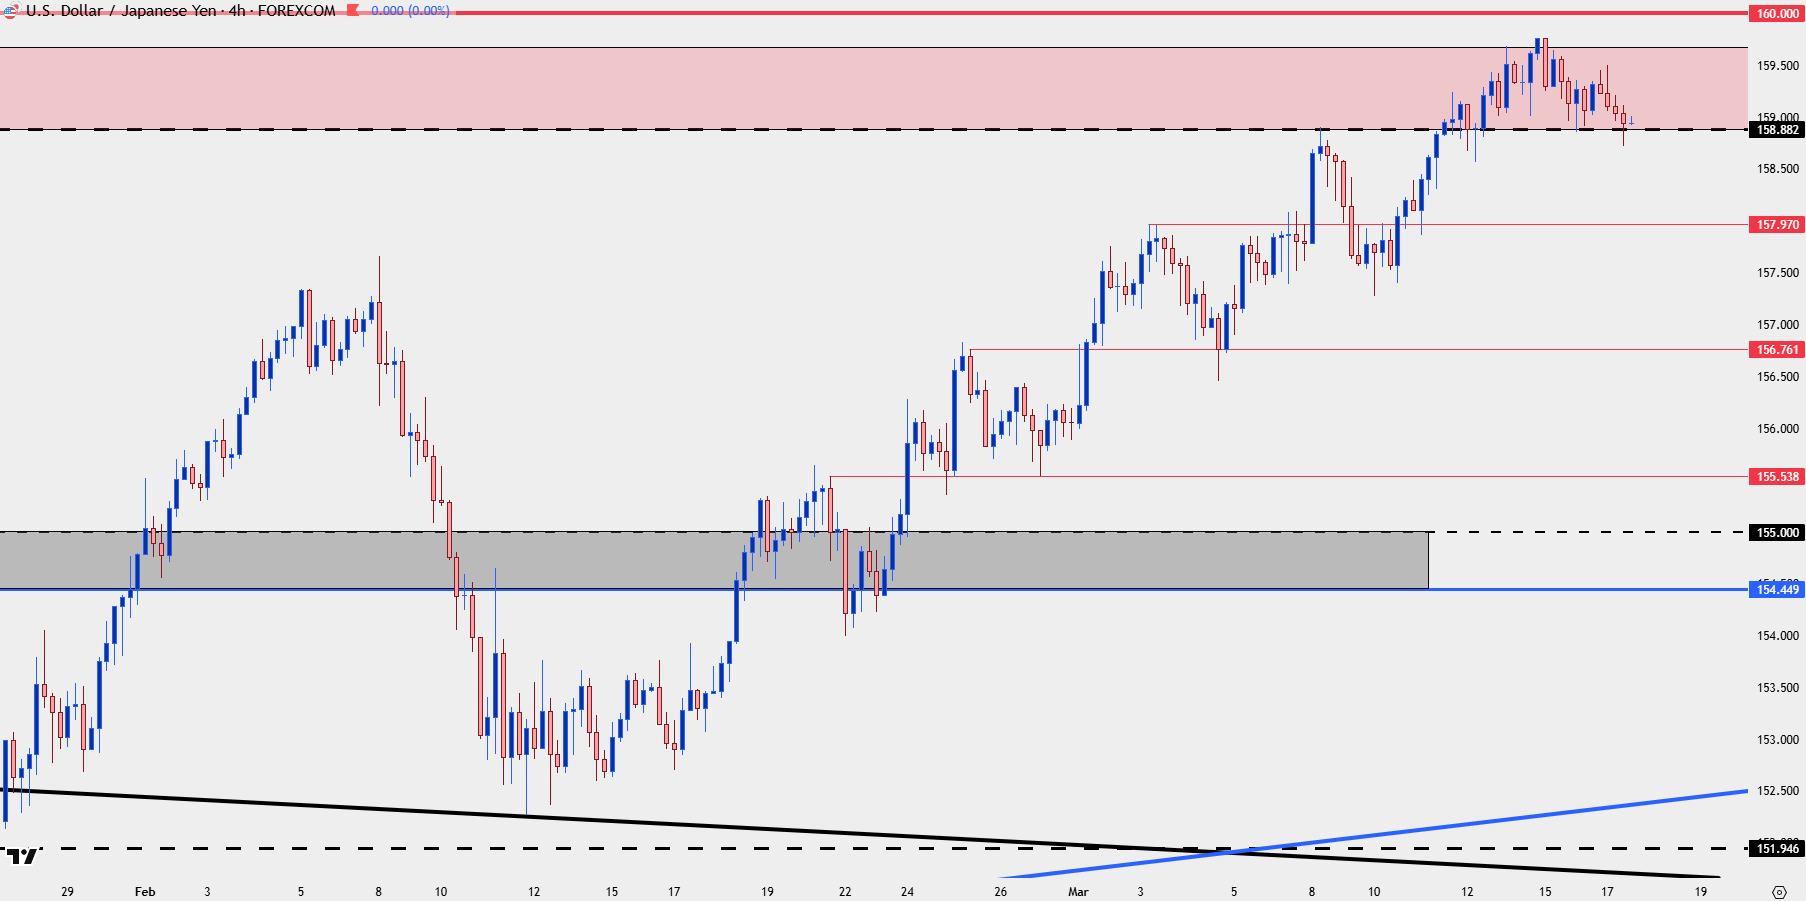
Chart prepared by James Stanley; data derived from Tradingview
--- written by James Stanley, Senior Market Analyst, Global Macro