


Q4 Price Action Setups
- Today marks the final day of Q3 and in this webinar I looked at what I thought were the four biggest items as we move into Q4.
- Last year saw a jump in yields and a rally in the USD after the Fed’s rate cut in September, and so far this year has shown a similar reaction.
- This is an archived webinar and you’re welcome to join the next live, click here to register.
As the door opens into Q4 there’s several stretched trends in asset classes ranging from gold to stocks to currencies. The big question for Q4 is whether we see a repeat scenario as last year, when Treasury yields spiked after the Fed started to cut rates, pretty much the opposite of what they hoped would happen.
But when the Federal Reserve cuts rates when inflation is already high, that boosts future inflation expectations, which further diminishes bond returns, and it makes little sense for an investor to sit in a bond that will be yielding less on a real basis as inflation further erodes that yields. This leads to selling in bonds and at the same time, there’s a greater attraction for stocks as a friendlier backdrop for corporates sets up higher potential earnings.
This is at least part of the reason why the USD rallied in Q4 last year even as the Fed cut rates. The currency sold off into the rate decision but after making a low on the day of the cut, sellers were stalled, and as the door opened into Q4, the rally took over. So far this year, the same scenario has shown.
Gold
Perhaps the most noticeable trend this year has been the continued rally in gold, which has now gained more than 90% from last year’s low. This year saw a bull pennant form after the high in April and that resembled the bull pennant from late last year. For the most recent episode, it was Powell’s speech at Jackson Hole that led to the breakout, and that breakout has only continued to gain momentum in the month and change since.
The Fed cutting rates into a low inflation backdrop similar helps to boost gold, such as we’ve seen over the past 19 months. For Q4, I see little reason to question the trend and, instead, look for pullbacks to open the door to trend following opportunity in gold, such as we had last week with the bull flag formation.
Gold Four-Hour Chart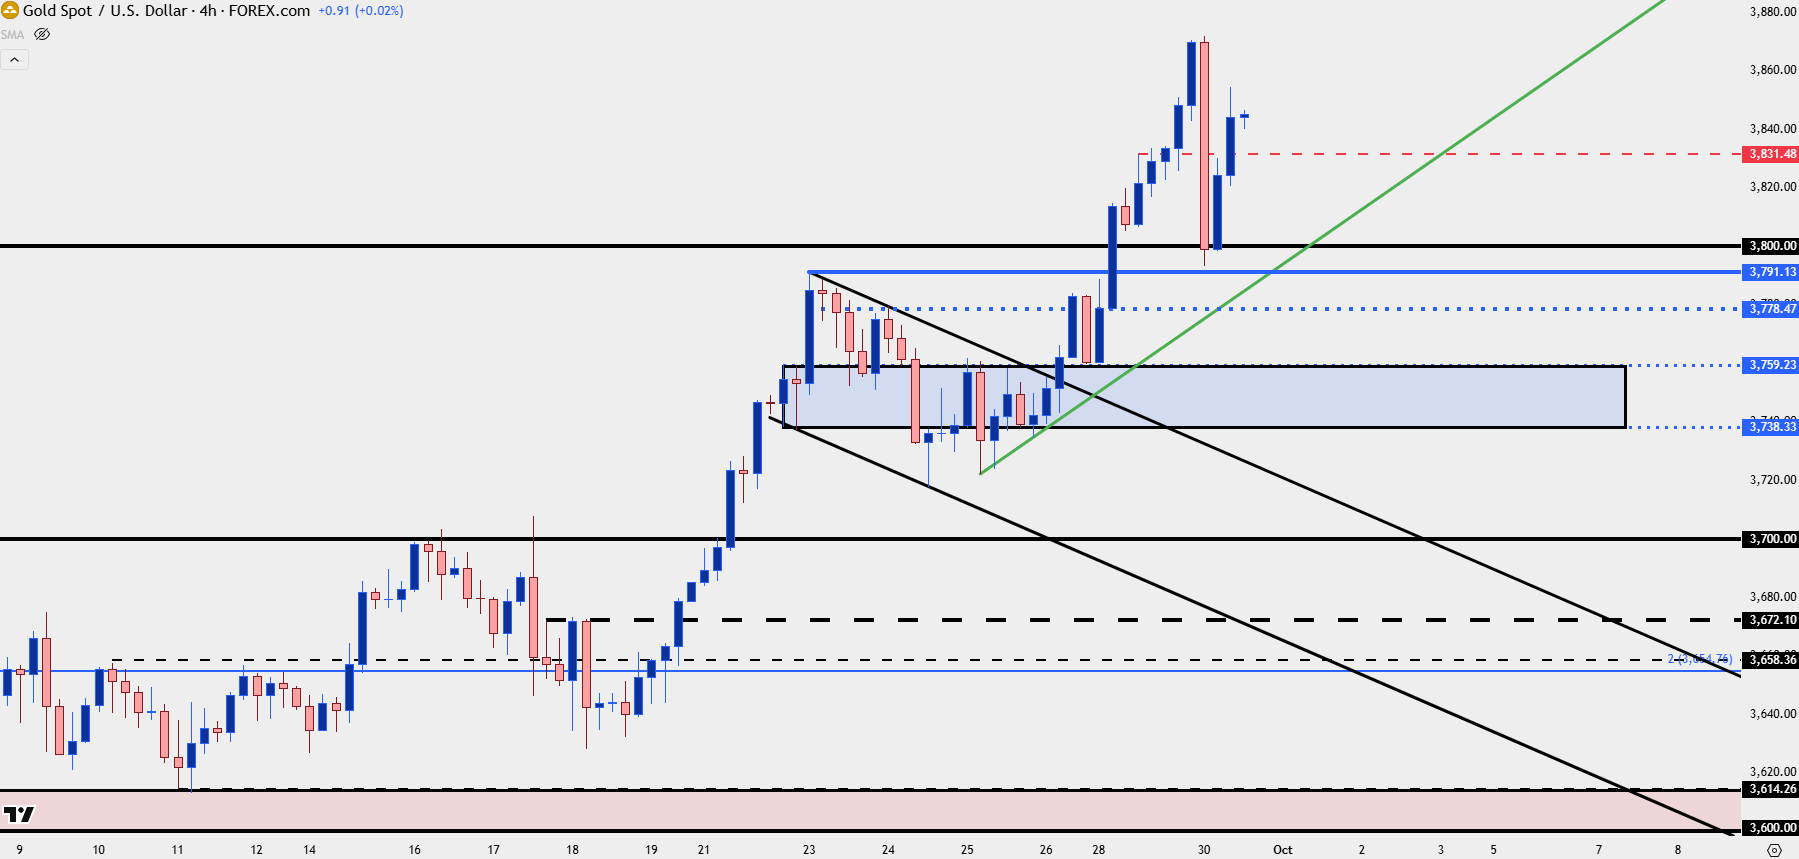
Chart prepared by James Stanley; data derived from Tradingview
Stocks
I cover equities in the quarterly forecasts and for this year, stocks were my top trade of the year but only after a pullback. That pullback arrived in late-Q1 and early-Q2 and the response since has been an aggressive resumption of rally.
We’ll be releasing Q4 forecasts in the coming days and my year-end target for SPX is 6948, or the 161.8% extension of the earlier-year sell-off. That’s confluent with the 7k level but, ideally, we’ll get some pullback to work with at some point during the quarter, at which point the 6500 level stands out as attractive. If that pullback turns into something more, it’s the 6148 level of prior resistance that hasn’t yet been tested for support.

SPX Daily Chart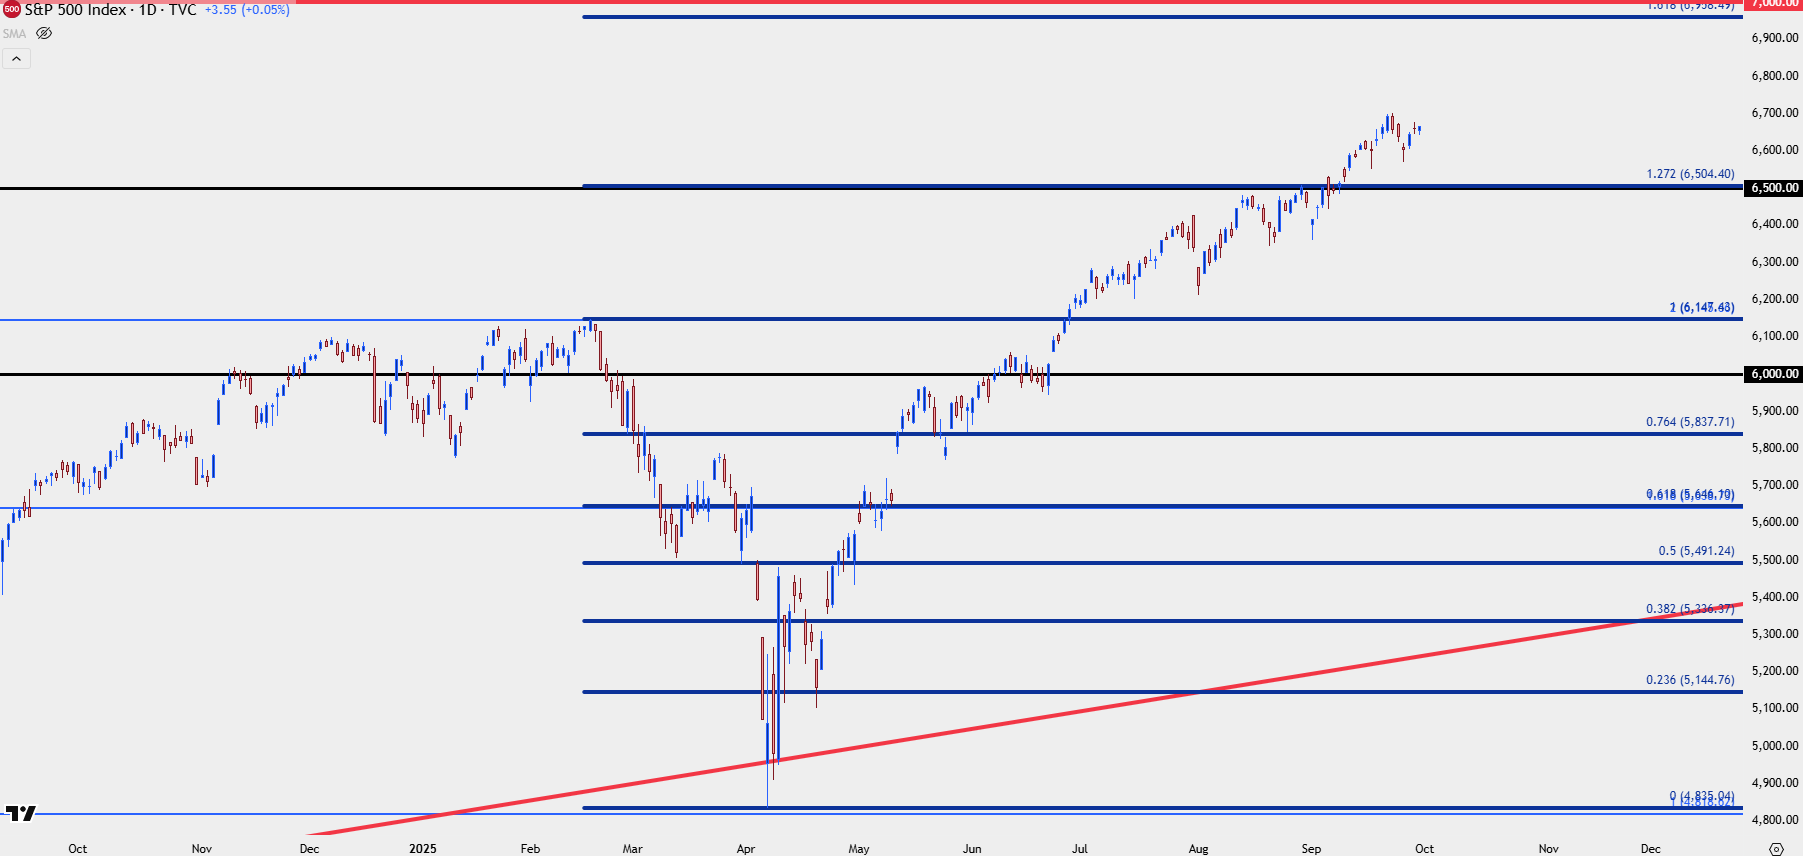
Chart prepared by James Stanley; data derived from Tradingview
Rates
If there’s one item that could unsettle matters its US Treasury rates. We saw this last year and it didn’t really take much of a toll until we got into the New Year, but as long-term rates jumped in the aftermath of the Fed’s rate cuts, there showed an opportunity cost for investors that had ridden the rally in equities. And it’s perhaps no coincidence that bonds rallied aggressively in February and March as stocks tanked on the back of tariffs.
For investors that haven’t had much opportunity to capture low-risk yield in US Treasuries, seeing the 10-year or 30-year at 5% can be attractive. On the same token, holding bonds when the Fed is cutting rates when inflation is already at 3% can be less and less attractive at current yields, as higher future inflation will only erode that fixed return by even more.
This is important for currencies as it was last year’s jump in yields that seemed to have more to do with the US Dollar’s price action than the lower rates from the Fed. And if you look at the below monthly chart of the 30-year bonds, it’s that 5% marker that’s a massive line in the sand.
30-Year US Treasury Yield Monthly Chart
Chart prepared by James Stanley; data derived from Tradingview
USD
It was a punishing first-half of the year for the US Dollar and as we move into Q4, the currency finds itself at a crossroads on the monthly chart. It’s been a bullish Q3 outlay as we wind towards the end of the quarter but bulls haven’t exactly taken over yet.
US Dollar Monthly Chart
Chart prepared by James Stanley; data derived from Tradingview
Last year saw the USD bottom right around the Fed’s first rate cut of the cycle and this year has shown a similar response in the immediate aftermath of the Fed’s cut, as USD jumped from a fresh three-year low and then continued to rally on the daily chart. At this point, the weekly chart remains with a similar falling wedge as last year, and that further keeps the door open for bulls with focus on the 99-level.
Key for that happening is EUR/USD, as I had looked at in yesterday’s article.
US Dollar Weekly Chart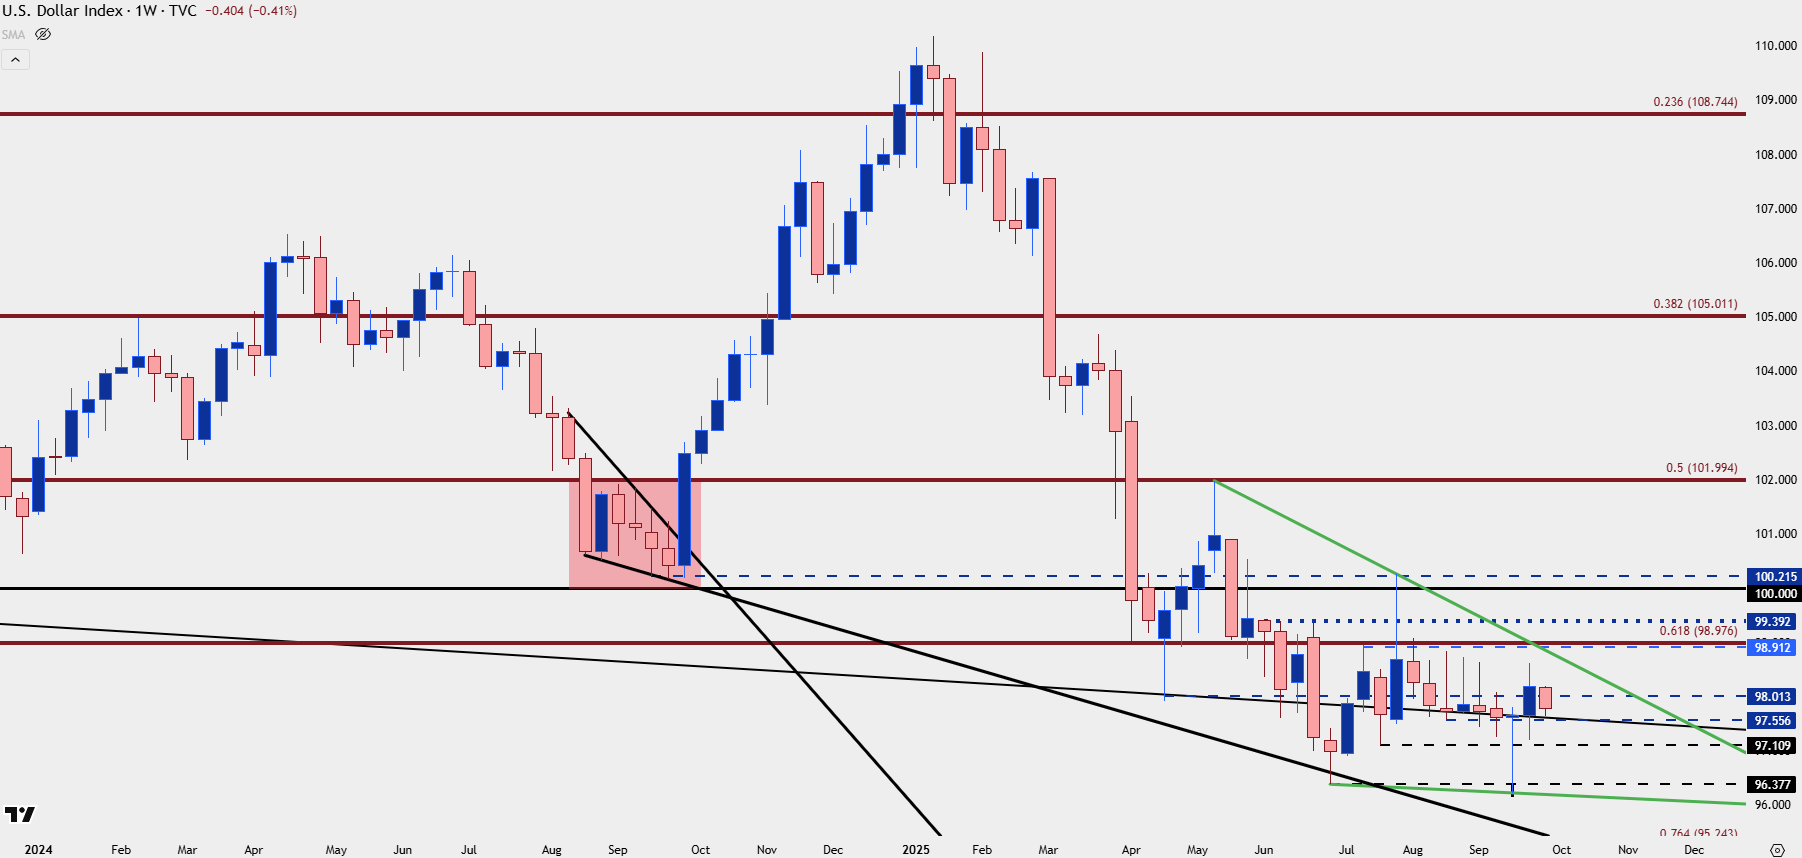
Chart prepared by James Stanley; data derived from Tradingview
--- written by James Stanley, Senior Strategist




