S&P 500 analysis: The benchmark US index has had an impressive run so far this year, but the question on every trader's mind is whether the current dip signals something bigger or just a breather. After a modest 0.5% gain last week, the index is now down around a similar level so far this week, leaving us just below recent record highs. Far from panic territory, right? It’s not time to call this a bear market yet, but caution is creeping in. There are plenty of factors to consider, from the latest US jobs data to come tomorrow to rising geopolitical tensions. And let's not forget the Fed, with Chairman Powell downplaying the likelihood of another big rate cut. All of this suggests a cautious approach, especially with the market still technically overbought. But for now, there’s no clear signal that we’re headed for a sharp reversal. Could that change this week?
Why has the rally stalled?
The S&P 500 rally had been on a tear, reaching levels where a pullback seemed inevitable. As much as we love a good rally, long-term charts were flashing overbought signals, and profit-taking had to happen eventually. This week, that’s exactly what we’re seeing—a bit of a cool-down.
Geopolitical risks are another key factor. The escalating tensions in the Middle East are weighing on investor sentiment, with Israel’s potential response to Iran’s missile attacks hanging over the market like a dark cloud. The situation could drag on, making traders even more reluctant to push stocks higher. Add to that the upcoming US election and some crucial earnings reports, and it’s clear why risk appetite is fading a little.

Geopolitical risks vs. Optimism over central banks
It’s a bit of a tug-of-war right now. On one side, optimism about central banks offering more easing measures helped boost risk sentiment last week. But this week? Not so much. Israel’s response—or lack thereof—has markets on edge, and if they decide to go after key Iranian assets, things could escalate quickly. A broader conflict could disrupt global energy supplies, and that’s the last thing investors need.
At the same time, while the Bank of England is hinting at more aggressive rate cuts, the focus is shifting to the US data calendar. Traders are watching closely the labour market numbers. Today’s headline ISM services PMI was much stronger at 54.9 compared to 51.5 in August. But the employment subcomponent fell to 48.1 from 50, pointing to a contraction in the sector’s hiring in September.
If Friday’s non-farm payrolls report also point at cooling employment, this could steer the Fed toward more rate cuts, but don’t hold your breath. Powell has already tempered expectations, and stronger-than-expected employment data might keep the Fed in a wait-and-see mode.
S&P 500 analysis: what’s next from a technical point of view?
The technical picture is still largely bullish, but we can’t ignore the risk of more profit-taking in the weeks ahead. The S&P 500 has posted gains for five straight months, surging over 40% since hitting a low in October 2023. That’s great, but even the strongest rallies need to take a breather at some point. The Relative Strength Index (RSI) is showing overbought conditions, hinting at possible consolidation.

The key support zone to watch is the area between 5613 and 5670. As long as the index holds there, bulls can sleep easy. But if that level breaks, we could be looking at a deeper pullback, with technical selling kicking in. On the flip side, if the rally regains steam, last week’s high of 5773 is the next target, with 5827 just beyond that.
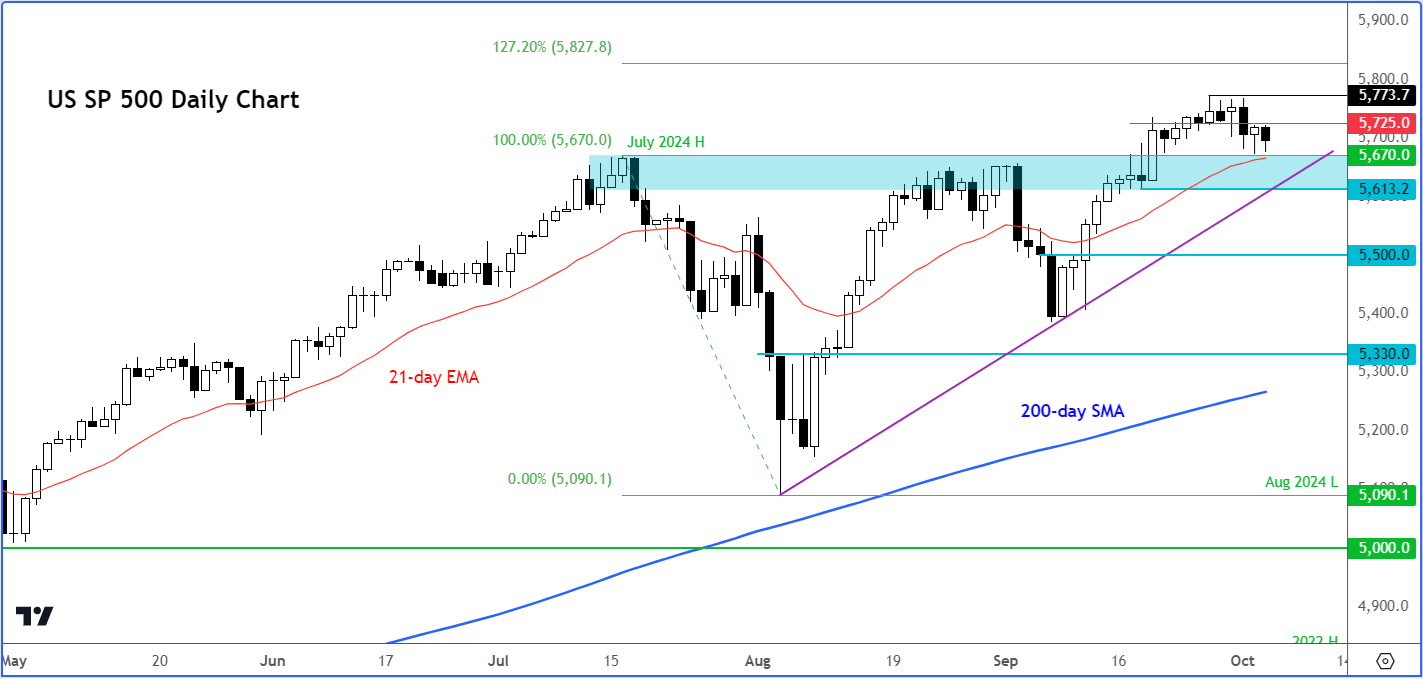
As we head into Q4, our S&P 500 analysis suggests that the combination of overbought technicals, geopolitical uncertainty, and mixed economic signals makes it likely we’ll see more volatility. So, don’t be surprised if we see more consolidation or even some downside risk as we move forward. For now, the bulls are hanging in there and we haven’t seen any technical signals to suggest the market has topped.
Source for all charts used in this article: TradingView.com
-- Written by Fawad Razaqzada, Market Analyst
Follow Fawad on Twitter @Trader_F_R