


Markets are throwing up mixed signals as we move into the latter stages of the first full week of the year. At this point, conviction is clearly lacking. US index futures edged lower overnight, but there’s little in that move to suggest anything approaching panic – even with geopolitical uncertainty swirling around Greenland and Venezuela. Elsewhere, the defensive mood is also apparent in cryptocurrencies, with Bitcoin and Ether once again under pressure. In the absence of a clear new catalyst, markets seem reluctant to fully embrace risk. The S&P 500 has been edging higher in recent weeks, but price action has remained fairly tight since late November, struggling to break out convincingly while also showing little desire for a meaningful pullback. For now, it feels like a market in wait-and-see mode. The upcoming earnings season may well provide the spark, but the more immediate focus is Friday’s December payrolls report. For now, the S&P 500 forecast remains cautiously positive.
Investors await the NFP release
Yesterday’s data offered a mixed picture, leaving investors unsure what to expect from Friday’s non-farm payrolls report. Consensus is looking for around 65K net job gains in December, broadly in line with the previous reading. ADP employment data landed roughly as expected at 41K. While ADP is far from a dependable predictor of official payrolls, it does little to challenge the idea that Friday’s report is unlikely to be weak enough to justify further Fed easing in the near term. That said, the job openings data was notably soft, partly offsetting the stronger ISM services print. Openings fell to their lowest level in over a year, while hiring slowed, reinforcing the view that employers remain cautious when it comes to adding staff. Today’s data calendar is relatively quiet, with weekly jobless claims the main item of note.
Keep an eye on tech stocks
One theme that’s becoming increasingly difficult to ignore is the question of tech leadership. The mega-cap names that have driven the bull market are starting to look less convincing as the market’s sole engine. Valuations remain stretched, and there’s growing unease over whether the scale of investment pouring into artificial intelligence can continue to justify itself. Apple has fallen for four consecutive sessions, while Nvidia has been treading water around the $190 mark since before Christmas. Without renewed leadership from tech, it may be difficult for equities to push meaningfully higher – particularly with the energy sector also under pressure as oil prices remain under pressure on the back of rising supplies. For equity bulls, a fresh surge in tech would likely be needed to drive the S&P 500 to new highs.
Technical S&P 500 forecast
So far, the S&P 500 cash index hasn’t reached the 7,000-mark, but the S&P 500 futures have. After briefly testing the 7,000 level, S&P futures have pulled back, with price action suggesting profit-taking at a key psychological and technical resistance zone. On both the futures and cash indices, this 7K area also aligns closely with the 161.8% Fibonacci extension of the prior major downswing from February last year, when markets sold off amid heightened tariff-related uncertainty.
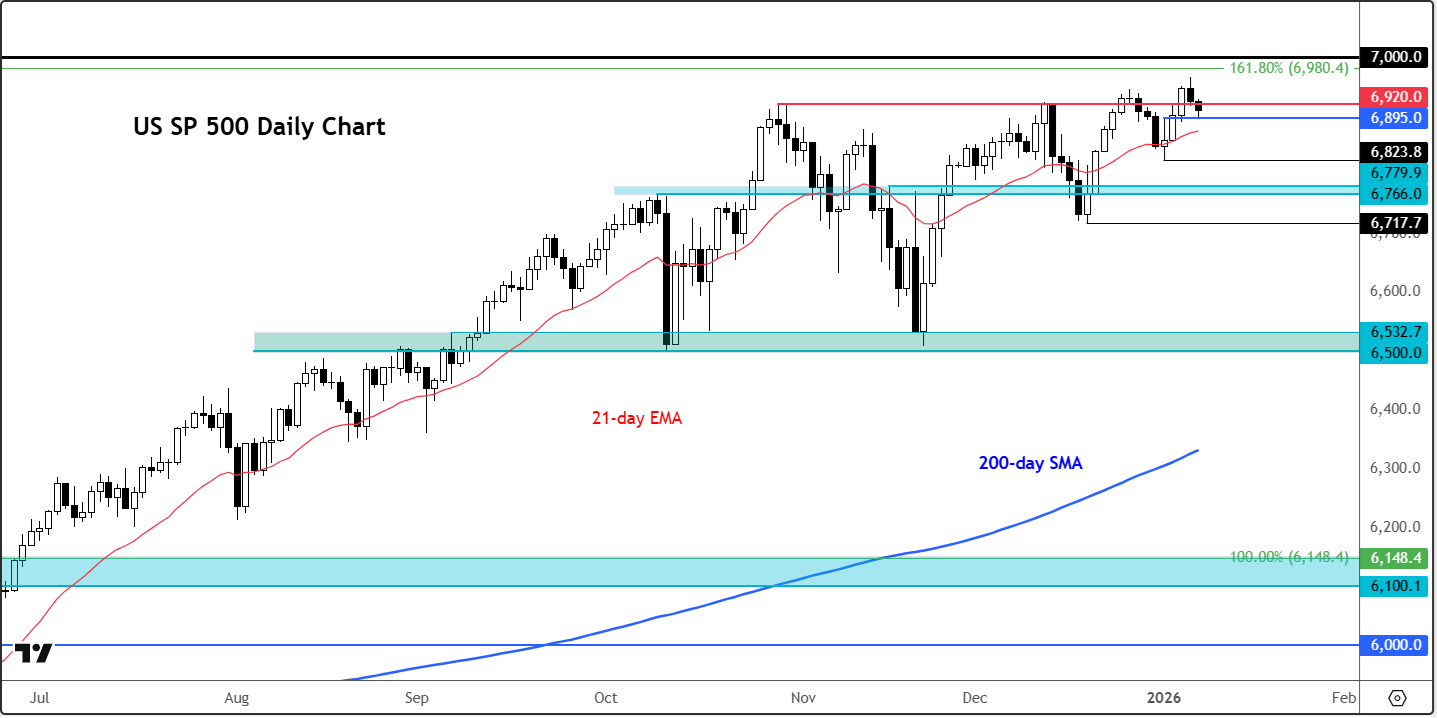
Looking at our US SP 500 chart, which is derived from the underlying S&P 500 futures, we can identify some tradeable levels. Since establishing a base in April of last year, the broader trend has remained firmly bullish, with price continuing to register higher highs and higher lows. However, momentum has moderated in recent months, indicating that upside follow-through is becoming more difficult. Investors appear to be waiting for a new macro or earnings-driven catalyst to sustain the advance.
Despite the slowdown in momentum, the lack of meaningful bearish drivers has limited downside pressure. This has resulted in a more compressed price structure, characterised by shallow pullbacks rather than impulsive selling. That said, waning momentum at elevated levels increases the risk of a corrective phase, particularly if key support levels fail to attract sufficient demand.
Key levels to watch
At this stage, there are no confirmed technical reversal signals. As a result, focus remains on nearby support zones. Initial support is located around 6,895, corresponding with the top of Friday’s range when the index created a doji formation. A break below this level would bring the 6,800 area into focus, followed by 6,766-6,780 range, which represents a more critical structural support. A sustained move below the 6,766-6,780 range could trigger an increase in volatility and a deeper retracement.
On the topside, the 7,000 level continues to act as the primary target. Beyond that, there are no clearly defined resistance levels, leaving price discovery firmly in play.

-- Written by Fawad Razaqzada, Market Analyst
Follow Fawad on Twitter @Trader_F_R




