
S&P 500, Nasdaq Talking Points:
- Stocks spent the week clawing back losses from the prior week that were fueled in-part by the massive revision to prior NFP reports.
- Markets are now expecting a cut in September with at least one more rate cut by the end of the year, but the Tuesday inflation report will likely impact that which can in-turn impact price action in equities.

We’ve come a long way from the shocking sell-off that showed up around the start of Q2, and now that we’re more than a month into Q3 buyers haven’t exactly left the situation. While Trump’s softening on tariffs was a vital component of the rally back in April, more recently it’s been the building hope of rate cuts from the Fed that’s kept markets rallying.
As that came into question last Thursday, from a combination of the FOMC rate decision the day prior and the Core PCE report released before market open, SPX put in a large bearish engulfing candlestick that led to a gap-down and a continued sell-off on Friday following the NFP report. Sellers were able to stretch all the way down to a support level at 6234, which I had last looked at a couple of weeks ago. That held support into the end of the prior week and then last week opened with a bang as stocks gapped-up and continued to rally through Friday trade.
For traders this isn’t necessarily a good thing as the sharp rally complicates trend following strategies. There is a nearby support now at the top of that prior gap from around NFP, plotted at 6339. But given the gap to start the week, there’s now a notable support zone to track from that same prior swing level of 6234 up to the 6271 level that marked last week’s open.
SPX Daily Chart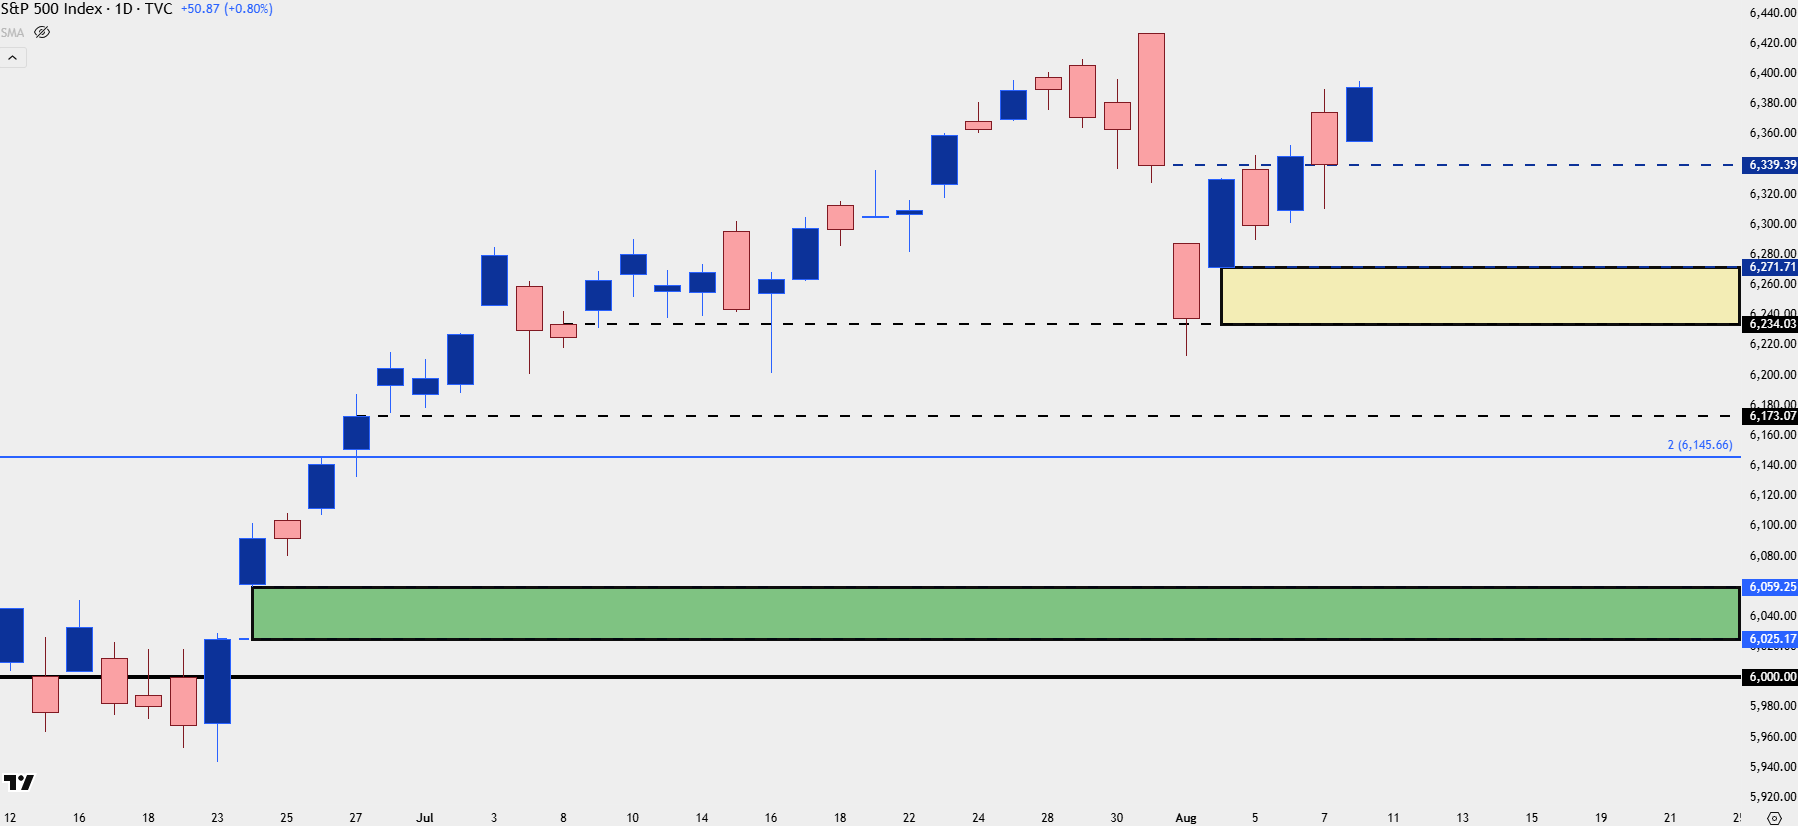
Chart prepared by James Stanley; data derived from Tradingview
SPX Bigger Picture
To say that the market feels frothy can come off as an understatement. The index rallied by almost 33% from the Q2 lows up to the highs in late-July and that’s a considerable amount of capital created in a very short period of time. This doesn’t necessarily mean that the rally needs to reverse as exuberance and optimism isn’t necessarily a direct-lead in to pain and negativity, but it does illustrate the challenge of working with a move that’s so entrenched on drivers that have long been expected to take place.
Which brings us to the rate cuts…
As data dimmed back in March and April probabilities for rate cuts from the Fed pushed higher. But, as we heard at the FOMC meeting in July given the continued health in the labor market, at least from the vantage point of the unemployment rate, along with the continued rise in inflation, Jerome Powell didn’t quite see that policy was too restrictive and needing to be softened. Similar data had shown at the CPI report on July 15th, which led to a one-day sell-off in SPX as prices pulled back to that same 6234 level.
On Tuesday, the next data point for CPI will be released and Core CPI is expected to print at an annualized rate of 3%, with headline CPI moving up to 2.8% from last month’s 2.7%. Given how widely expected and priced-in rate cuts are, this can make for a difficult backdrop for the Fed to cut rates at their next meeting in September, which markets are currently expecting to a 89.4% probability.
Where this comes in for traders is the possibility of pullbacks, a reason for longs to close if data shows continued high inflation, which brings question to the Fed’s ability to cut rates at that meeting next month. For that scenario, the aforementioned gap from last week’s open is oft interest, running down towards that same 6234 level. But, below that is another notable level at 6145 which is a 100% measured move of the 2022 sell-off, which also happened to catch the highs in February before the tariff-fueled sell-off took over. Notably, that price hasn’t yet been re-tested as support since the breakout in June – which initially launched on the back of Michelle Bowman’s comment that she would support a rate cut in July. This illustrates how important that rate cut hope theme has been for equity prices over the past few months.
SPX Weekly Price Chart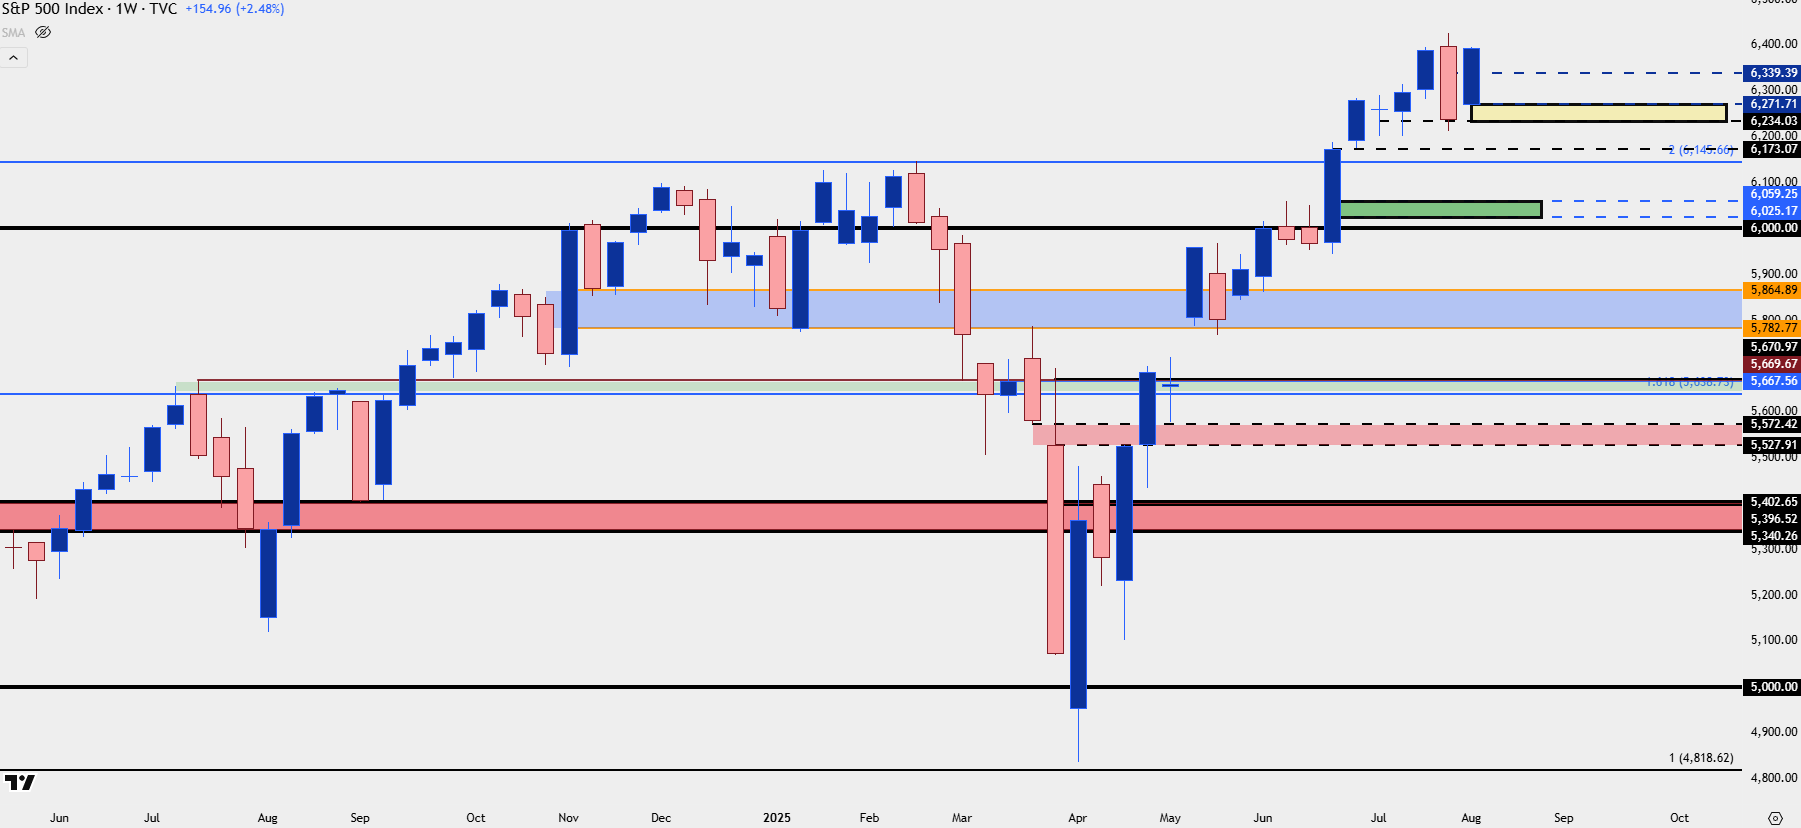
Chart prepared by James Stanley; data derived from Tradingview
Nasdaq
While the S&P 500 hasn’t quite pushed back up to a fresh all-time-high, the Nasdaq has and the running tally from the Q2 lows is now at a whopping 42.7%. A similar quandary exists here, however, as prices have rallied so far so fast that buyers looking to impose strategy can be challenged with entry on continuation themes. So, first and foremost, if inflation does come out soft and below market expectations next Tuesday, the Nasdaq seems a logical venue to look for breakouts and breakout continuation scenarios. But, similar to the above, if we do end up with a hot inflation read this becomes a pullback candidate and on the next chart, I’ll look at a few areas of interest to work with that theme.
Nasdaq Weekly Chart
Chart prepared by James Stanley; data derived from Tradingview
Nasdaq Shorter-Term
There’s some gap to work with in NDX and last week showed a strong gap-fill setup from the Thursday open which filled during the session before the push up to a fresh ATH on Friday. There’s still a level of interest down there, however, as this prior level of resistance has now shown as support, and that plots at 23,236.
Below that we have the unfilled gap from the weekly open, running from 22,763-22,973 and then below that, we have some remaining unfilled gap from around that same Michelle Bowman comment in late-June. If this is to come into play it would be a significant test, very similar to the area around 17k that I had looked at in the Q2 Forecast. Failure from bulls to hold that opens the door for a larger, more sizable sell-off and this would likely be something taking place amidst a broader trend change in US and perhaps even global equities.
Nasdaq Daily Chart
Chart prepared by James Stanley; data derived from Tradingview
Dow Jones
On that topic of gap fill, the support zone looked at in the forecast from late-July came in handy as it helped to catch the lows on the August 1st sell-off. That zone plots from 43,386-43,505 and it remains of note as the Dow hasn’t been able to string together a rally resembling that of either of the above two indices. The ‘s2’ level looked at in that prior forecast also came into play, helping to hold the lows on Thursday at 43,819 and that, again, derives from a prior gap in the index.
At this point I think it’s difficult to be as excited for bullish continuation scenarios in the Dow as either the Nasdaq or S&P 500, but there is a bullish item on the longer-term chart that I’ll look at in a moment.
For now, the focus is on structure and it’s those same support levels that remain of note, at 44,025, 43,819 and then the zone from 43,386-43,505.
Dow Jones Daily Chart
Chart prepared by James Stanley; data derived from Tradingview
Dow Longer-Term
The item that paints this as a more bullish picture is the weekly chart, where an inverse head and shoulders pattern remains in-play for the Dow. The neckline at 45,000 has been a tough area for bulls to crack and it again led to a pullback when it was in-play three weeks ago.
But given the shorter-term bullish structure there’s at least still some potential for bulls to run a breakout, and if that 45k level does finally give way, it could usher in a strong continuation scenario for topside setups.
Dow Weekly Price Chart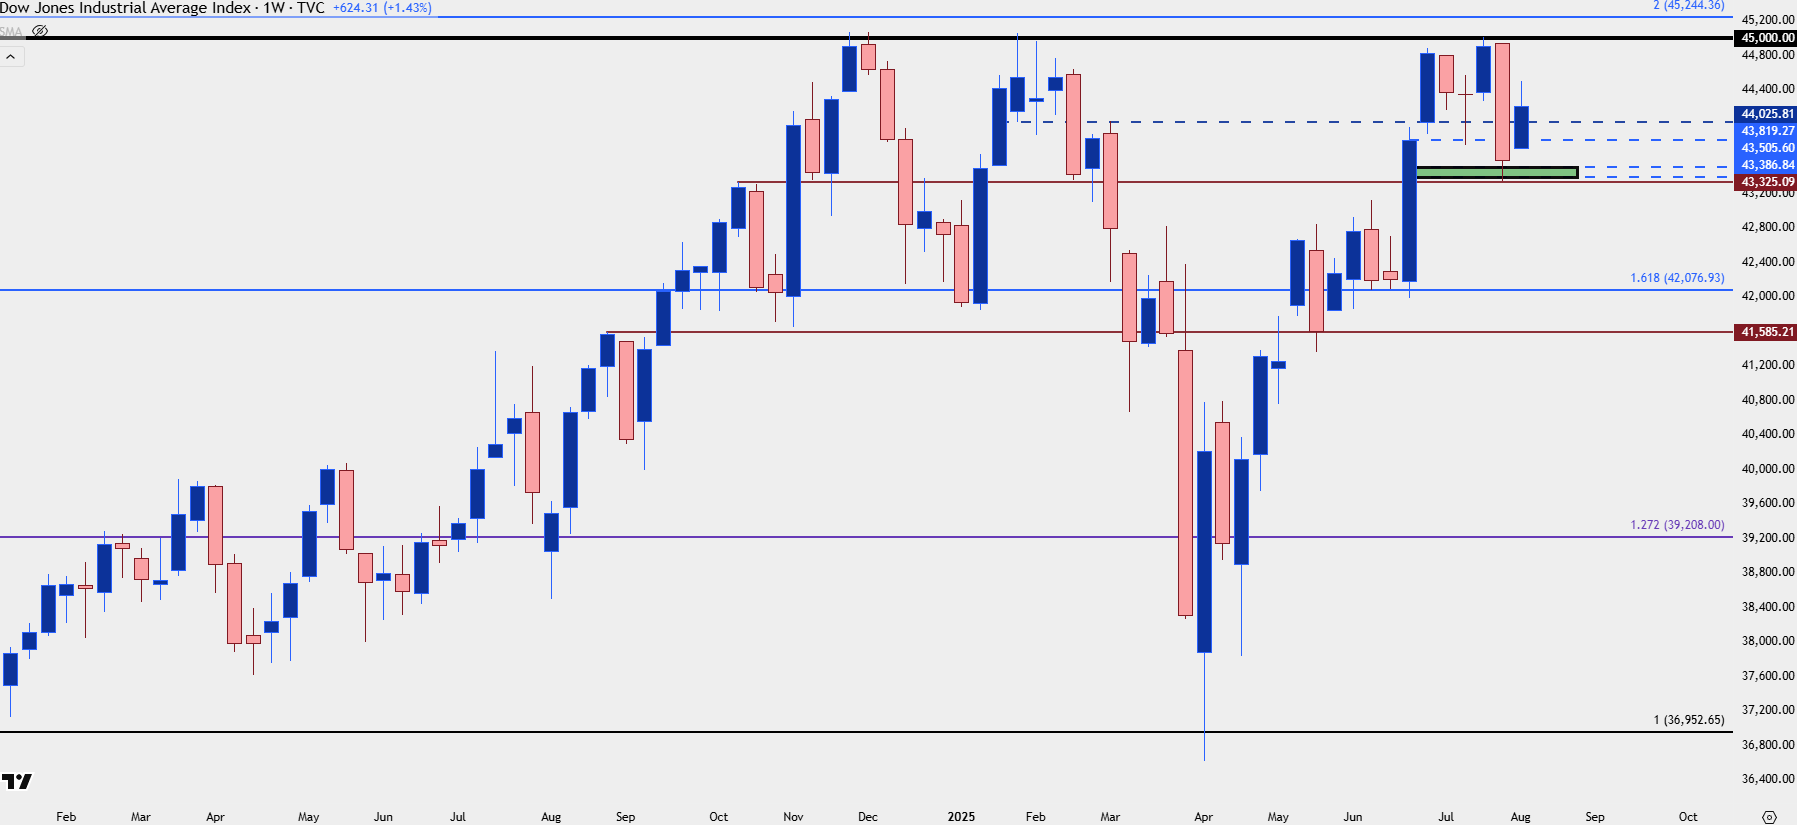
Chart prepared by James Stanley; data derived from Tradingview
--- written by James Stanley, Senior Strategist