

Last year’s tangle with tariffs made a major dent in equity prices from late February and through early-April. The uncertainty seemed to pick up through the month of March and along with it, traders sold stocks at a brisk pace until we eventually had an oversold reading on the weekly chart of the S&P 500, and that’s a somewhat rare event.
But just as some noted talking heads began to warn of a ‘Black Monday’ event, President Trump softened on his Liberation Day announcement and stocks began to find their footing. He then used that tariff carrot multiple times to help guide equity prices higher and that eventually led to a whopping 45% rally in the S&P 500 and a 60% rally in the Nasdaq 100.
While it was the softening of tariffs that ultimately drove the demand for equities the rally that built after was historic in scope. And that’s become somewhat of the challenge in early-2026 trade, as heavy one-sided positioning on the long side of equities has made for a challenge in the S&P 500 at the 7k psychological level. So, like February a year ago, we may be in a backdrop where a pullback can show while retaining a healthy longer-term outlook.
Given that Trump is going into mid-terms later this year any ramping of tensions would likely need to be contained, to a degree. The US data that dropped on Friday wasn’t exactly an encouraging factor as GDP came in at half the expected 2.8% reading while Core PCE printed with a 3-handle. This puts the Fed in a more difficult position where inflation demands prudence even while slowing growth may otherwise nudge them towards rate cuts.
In the cash index of SPX the tension at 7k has been clear. Bears haven’t exactly been able to run a break yet as there’s been repeated support holds at 6800. But, there have been slightly lower-lows, which suggests that a persistent enough push could eventually lead to a downside breach.
SPX Weekly Price Chart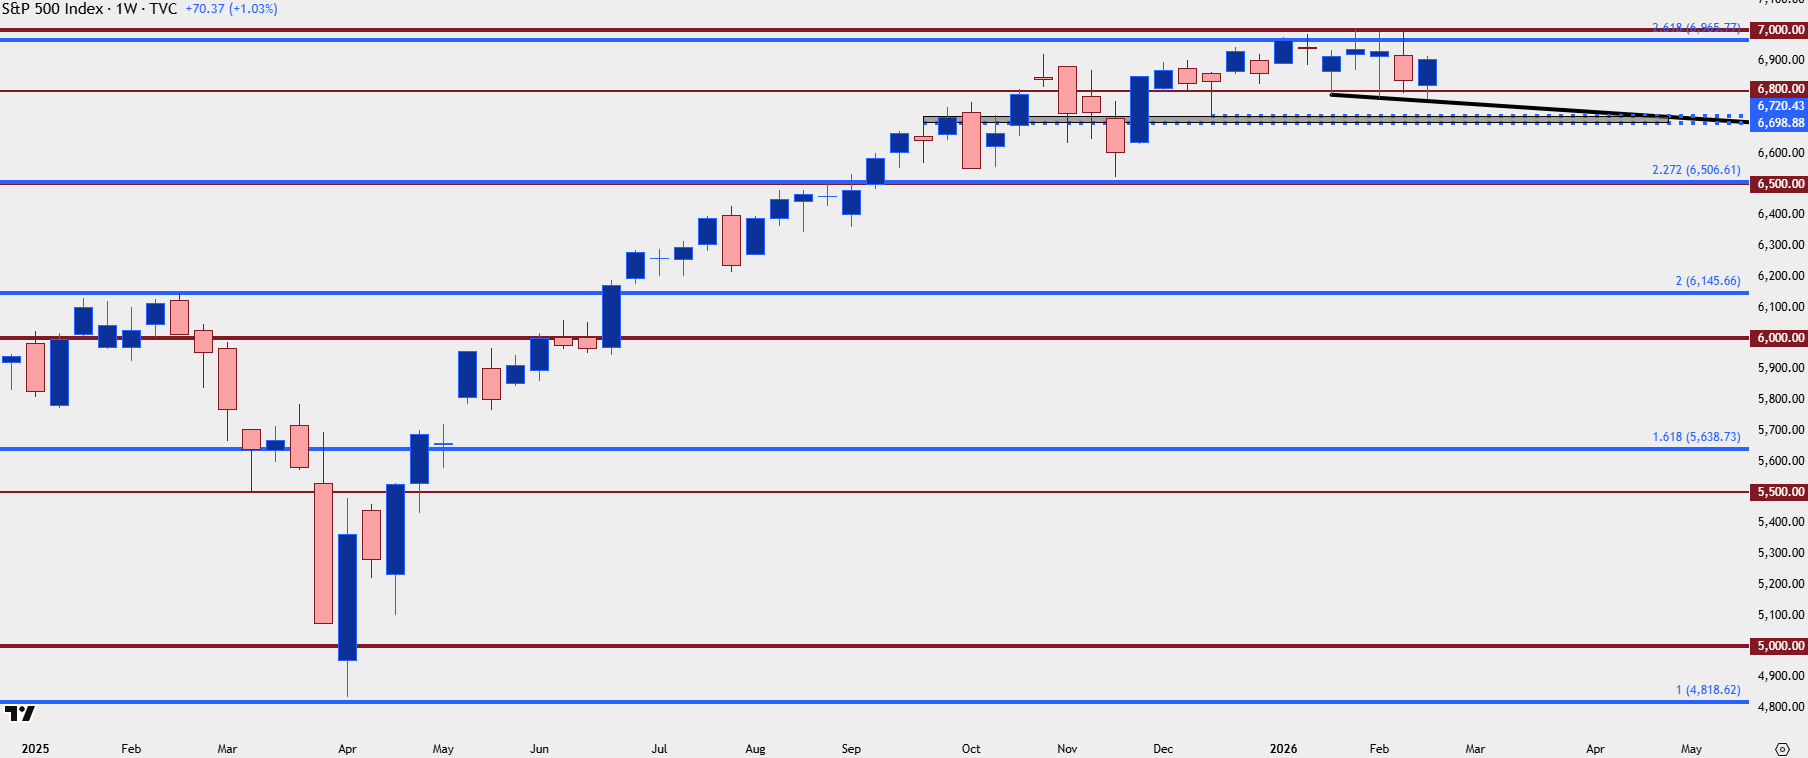
Chart prepared by James Stanley; data derived from Tradingview
SPX Shorter-Term
The daily chart of SPX has been incredibly choppy but it has been mean-reverting for the entirety of 2026, so far. The Fibonacci extensions discussed in the 2026 forecast (as well as the 2025 forecast) remain in-play today, with the 6145 level standing out as a significant spot as this is what helped to set resistance last February just before the tariff tension drove a breakdown.
Notably that zone hasn’t been tested for support yet although it’s so far away that for it to come into play, we’d likely need to see a bit of panic developing. For now, a more stable area to look for support is around the 6700 level, as this was a prior spot of resistance that held the lows on a pullback in December.
Below that, there’s a Fibonacci extension confluent with a prior price swing around the 6500 psychological level, and that sets up for an attractive spot to look for a bullish reversal if we do see bears finally able to take out 6800 (and 6700 after that).
SPX Daily Price Chart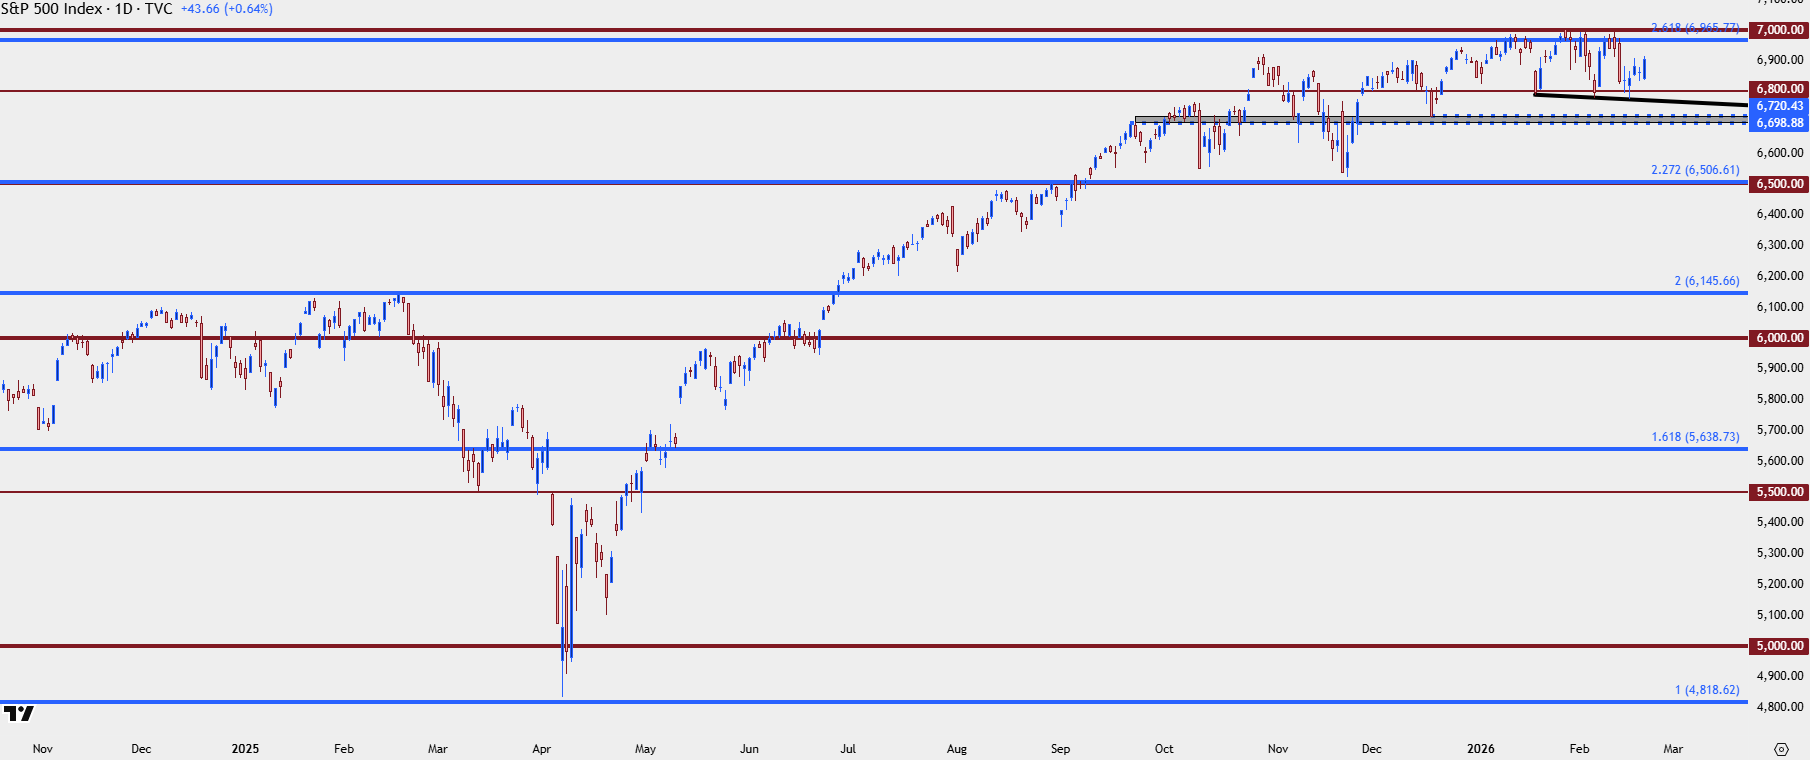
Chart prepared by James Stanley; data derived from Tradingview
Nasdaq 100
The Nasdaq 100 backdrop looks a bit more ominous and given how it was large cap tech that led the chart from last April’s lows and, to a larger degree, the rally from the 2022 lows, this can paint a less optimistic picture of near-term equity trends.
In the Nasdaq 100 the ATH was set on October 29th, which was a Federal Reserve rate decision. At that meeting the Fed cut but they didn’t sound optimistic about additional cuts, and that hit both the S&P 500 and the tech-heavy Nasdaq.
Since then there has been shows of recovery but unlike the S&P 500 above, the Nasdaq has not been able to re-test that prior ATH. In the S&P 500 it’s almost explainable and understandable that we’ve seen stalling given the 7k level that’s held bulls back from further breakout. But in the Nasdaq, it’s almost as if buyers have continually shied away from breakouts when price has opened the door for such.
With all that said, the support for the index is a bit more clear given confluence around the 24k level. A hold there with an underside wick on the daily chart opens the door for a bounce setup in the index – but if that doesn’t hold, the fall could come fast and that would put attention on deeper support around the 22,600 area.
Nasdaq 100 Futures – Weekly Chart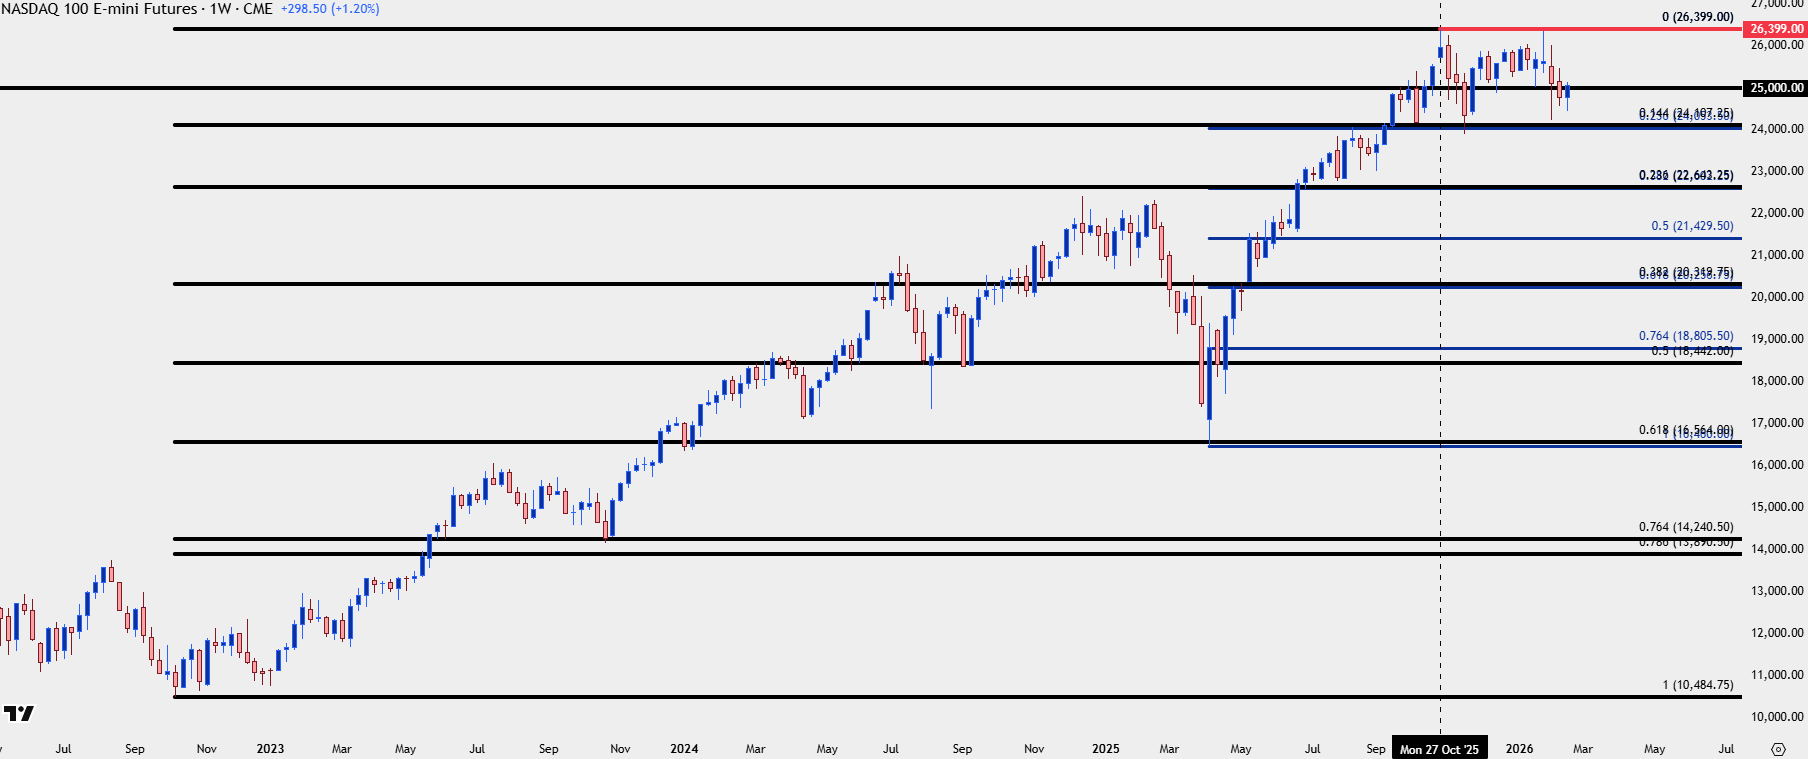
Chart prepared by James Stanley; data derived from Tradingview
Russell 2000
The laggard has become the leader so far in 2026. While the small cap index didn’t enjoy the same enthusiasm as either of the two above indices did in 2023 or 2024, the Russell 2000 started to come to life in late 2025 and that extended through the New Year as the index rallied up to a fresh all-time-high.
At this point there’s a bull pennant formation that’s active in RTY and if looking to push bullish equity themes this backdrop is more attractive than either SPX or NQ.
If we do see the deeper pullback scenario, I’m tracking an s1 support at 2605 and an s2 around 2560, with a key zone from 2460-2500.
Russell 2000 Daily Price Chart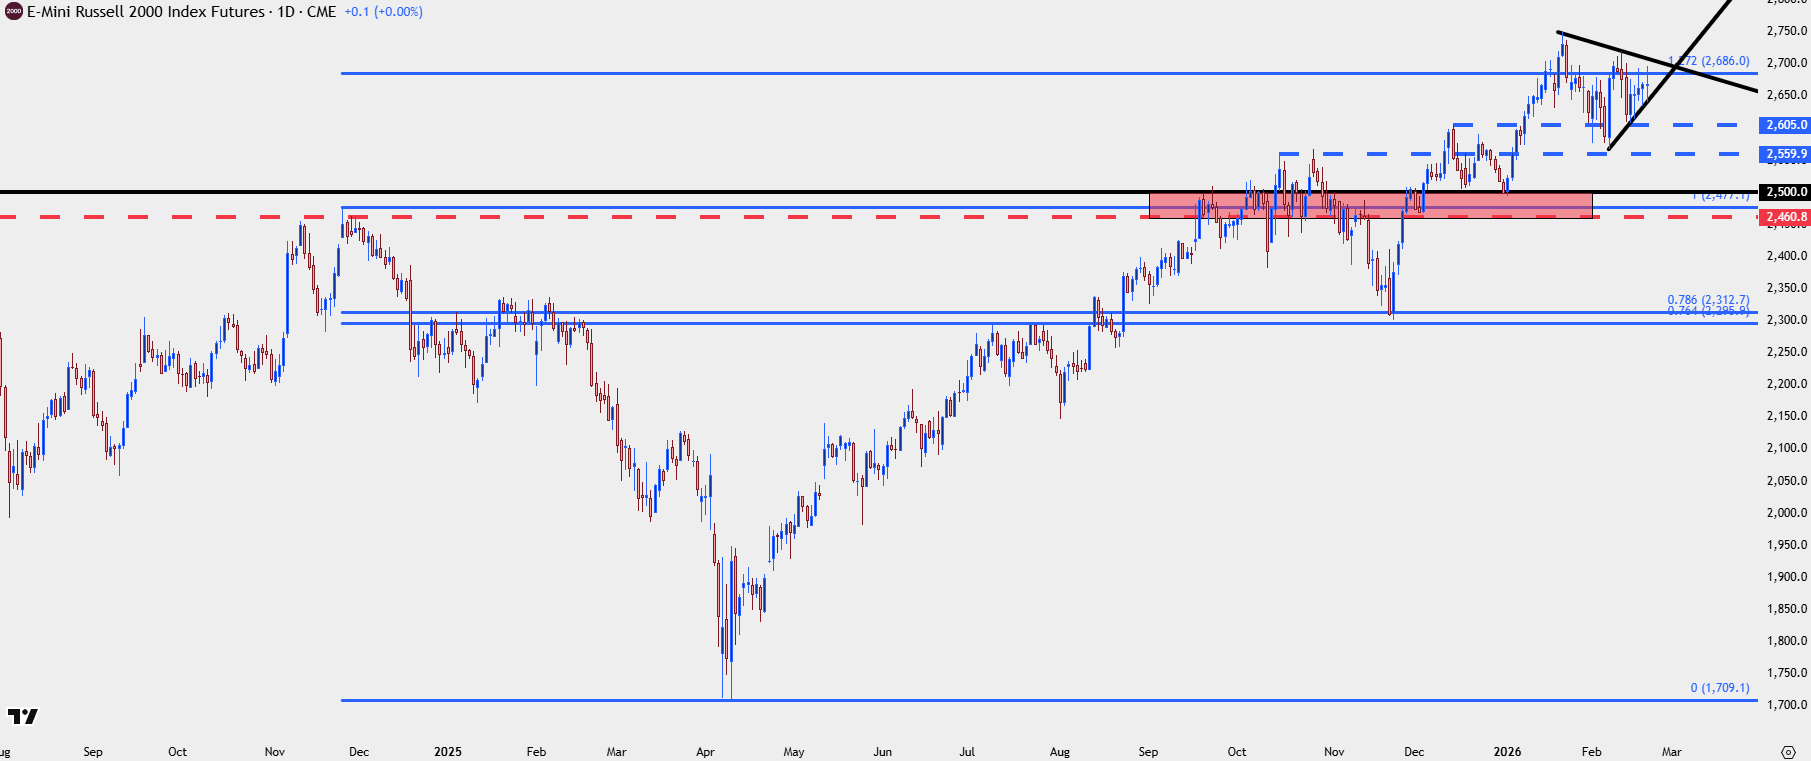
Chart prepared by James Stanley; data derived from Tradingview
--- written by James Stanley, Senior Market Analyst, Global Macro