
Key Events
- Bitcoin losses tested the 80,000 zone, with oversold weekly momentum last seen in 2022 attracting bullish interest.
- Nasdaq dropped to the key 23,900 support zone, consolidating in line with the broader market’s directional bias.
- Japan’s stimulus efforts and exhausted sentiment across 2025 have clouded prospects for new record highs in 2025 unless key resistance levels are decisively broken.
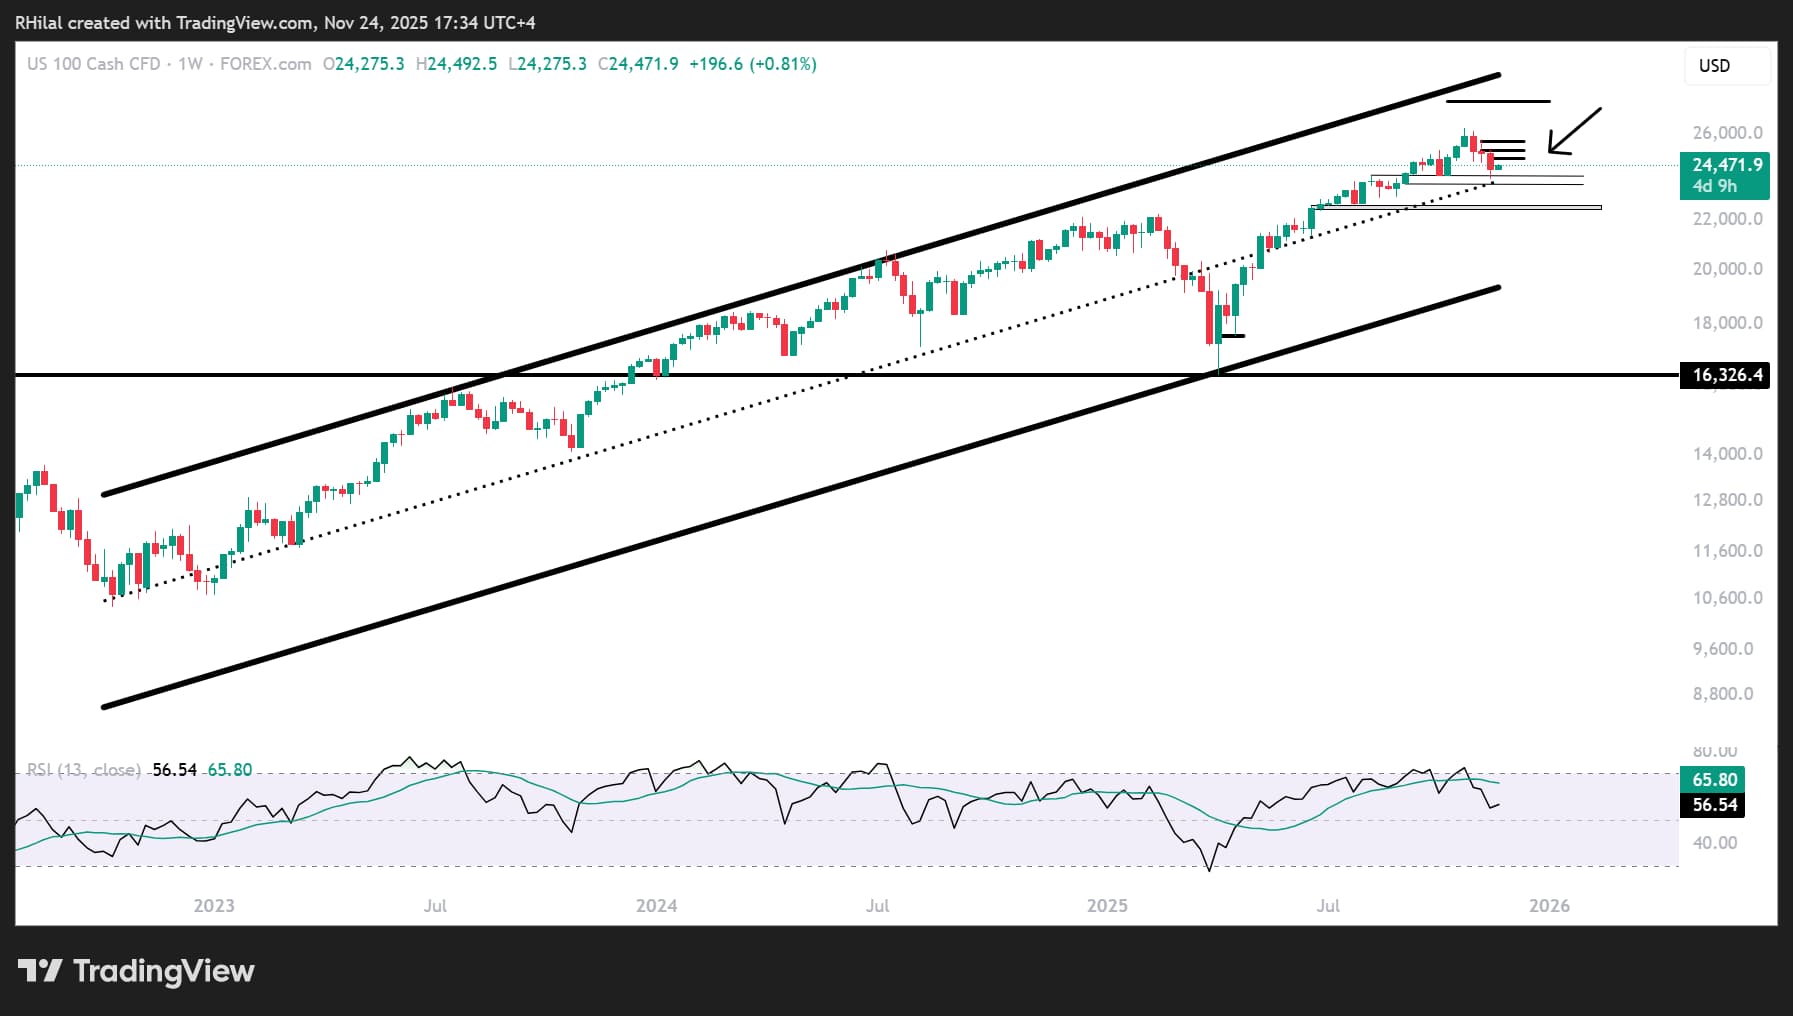
Nasdaq Outlook: Weekly Time Frame – Log Scale
Source: Trading view
From a weekly perspective, Nasdaq has pulled back toward the trendline connecting consecutive higher lows since October 2022, a line previously breached once during the reciprocal tariff-driven drop in April 2025, now intersecting near the 23,900-support zone.
The 23,900 level also coincides with the 0.236 Fibonacci retracement of the uptrend from April to October 2025, reinforcing its technical importance.
Bullish Scenario: A clean hold above 23,900 could redirect gains toward record highs, signaling renewed bullish momentum.
Bearish Scenario: A confirmed move and hold below 23,900 would likely deepen the retracement by roughly 1,000 points.
Shorter-term price levels are further defined on the 2-day time frame below
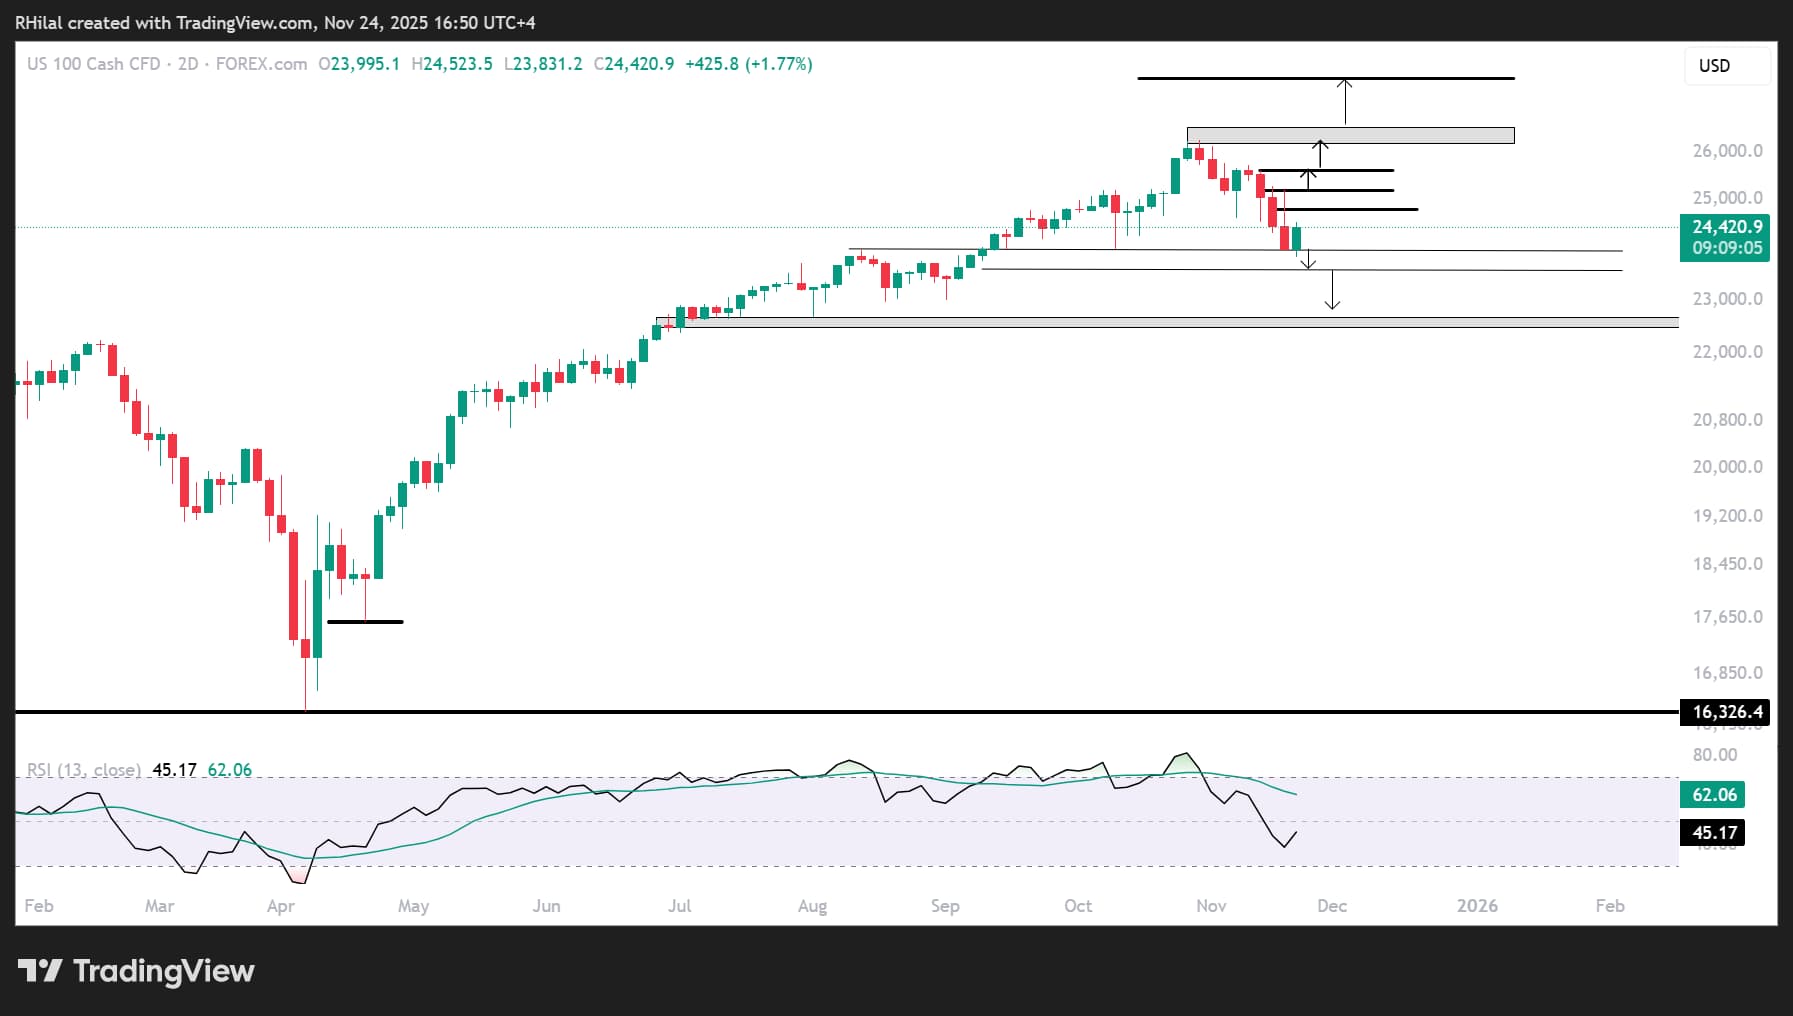
Nasdaq Outlook: 2-Day Time Frame – Log Scale
Source: Trading view
From a 2-day perspective—which filters out short-term noise compared to the daily chart—the immediate support and resistance levels can be outlined as follows:
Upside risks: A confirmed hold back above 24,800 could redirect gains toward resistance levels at 25,200, 25,700, and 26,300, before validating a breakout to new record highs near the 27,000 zone.
Downside risks: A sustained move below 23,900 could extend the retracement from 2025’s record highs toward support zones at 23,500, 22,900, and 22,700, where renewed buy-the-dip opportunities may emerge.
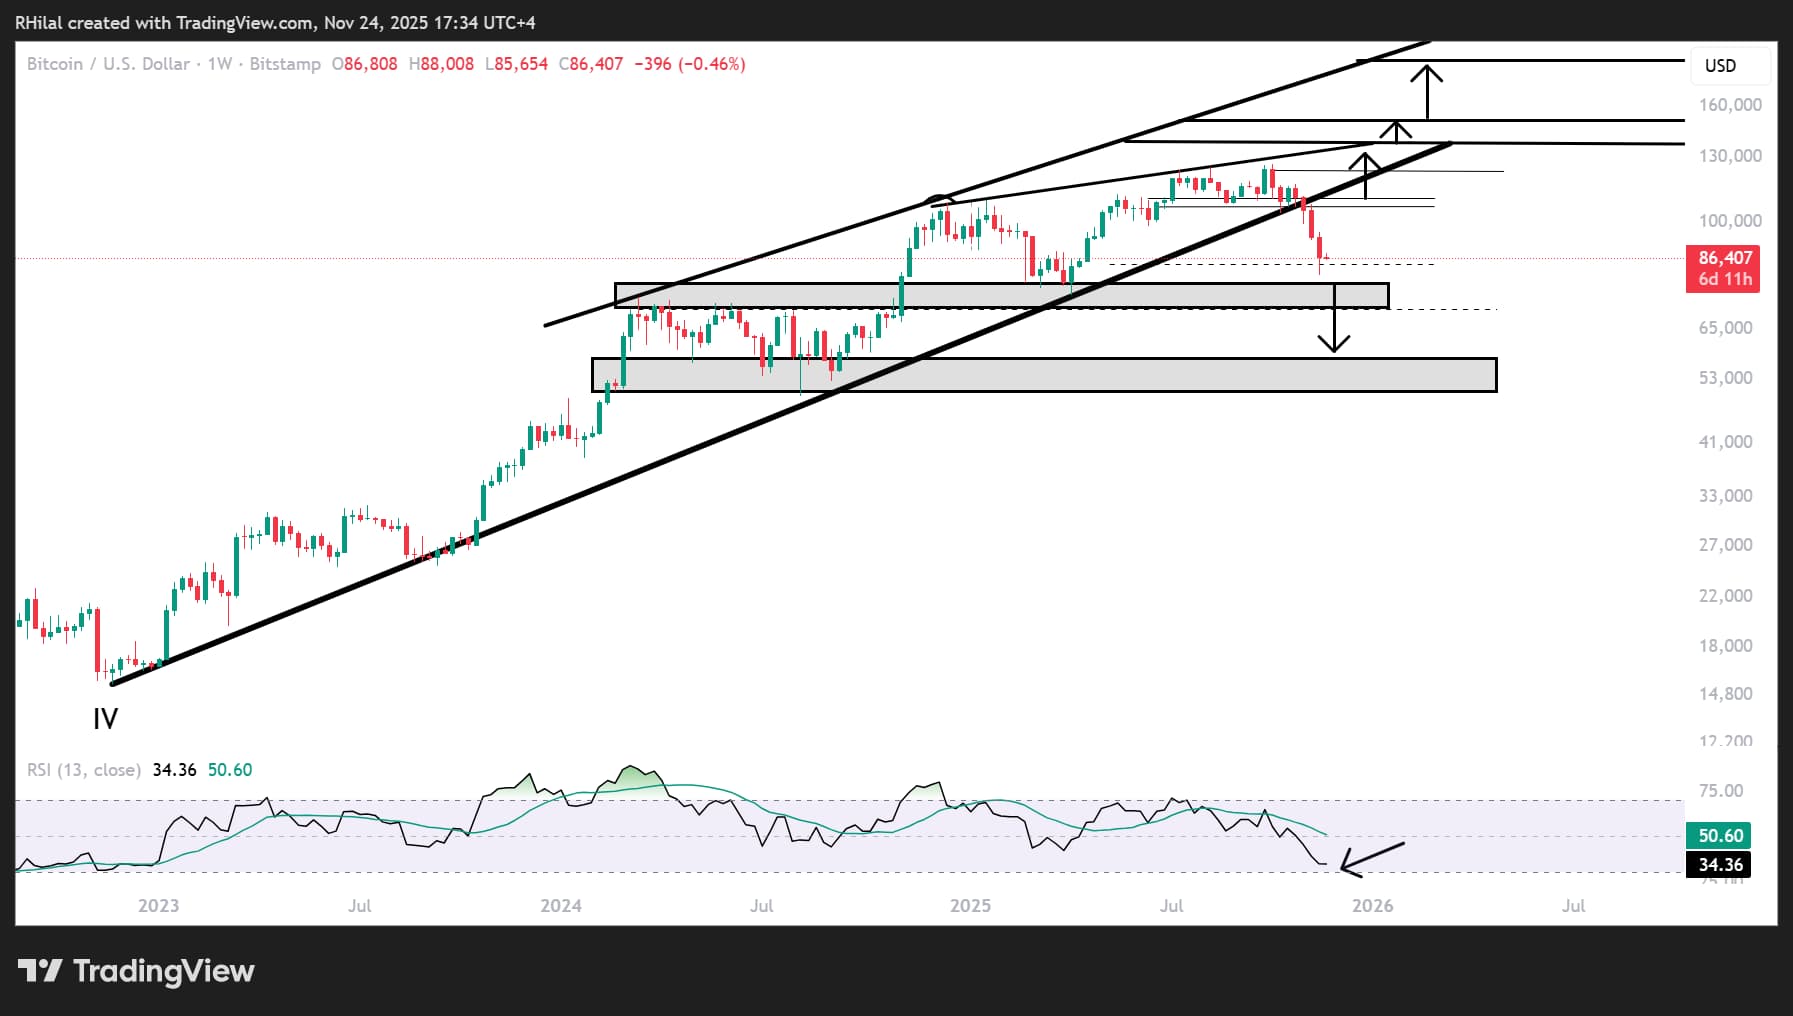
Bitcoin Outlook: Weekly Time Frame – Log Scale
Source: Tradingview
From a weekly standpoint, Bitcoin has surrendered its prior bullish structure after closing below the trendline connecting consecutive higher highs since the November 2022 lows, below the 98,000 support. The move brought prices back to the 80,000 zone, following a double-top reversal pattern between 124,000 and 126,000.
Despite the recent selloff, the weekly Relative Strength Index (RSI) has returned to oversold levels last seen in 2022—attracting bulls to evaluate potential buy-the-dip setups aligned with the broader market sentiment.
Upside risks:
A close back above 98,000 and 110,000 could realign gains toward previous records, with the first major resistance at 138,000, aligning with the trendline connecting consecutive highs between 2024 and 2025. A further breakout above this threshold could extend gains toward 150,000 and eventually 200,000.
Downside risks:
A confirmed close below 80,000 may expose reversal opportunities near the 74,000–70,000 zone. In more extreme scenarios, a decisive close below 70,000 could trigger an additional decline toward the 50,000 area before resuming a broader bullish trajectory.
Following steep policy shifts, stretched sentiment, and elevated valuations across multiple sectors this year, momentum appears to be slowing ahead of the holidays and the new year. This presents consolidation risks across markets, until a clean hold above key resistance levels emerges.
Written by Razan Hilal, CMT
Follow on X: @Rh_waves