sp 500 daily outlook wed 09 sep pull back before potential new rise above 1961 support 2125392015
(Click to enlarge charts) What happened yesterday The U.S. SP 500 Index (proxy for the S&P 500) has managed to break the upside trigger level […]

(Click to enlarge charts) What happened yesterday The U.S. SP 500 Index (proxy for the S&P 500) has managed to break the upside trigger level […]

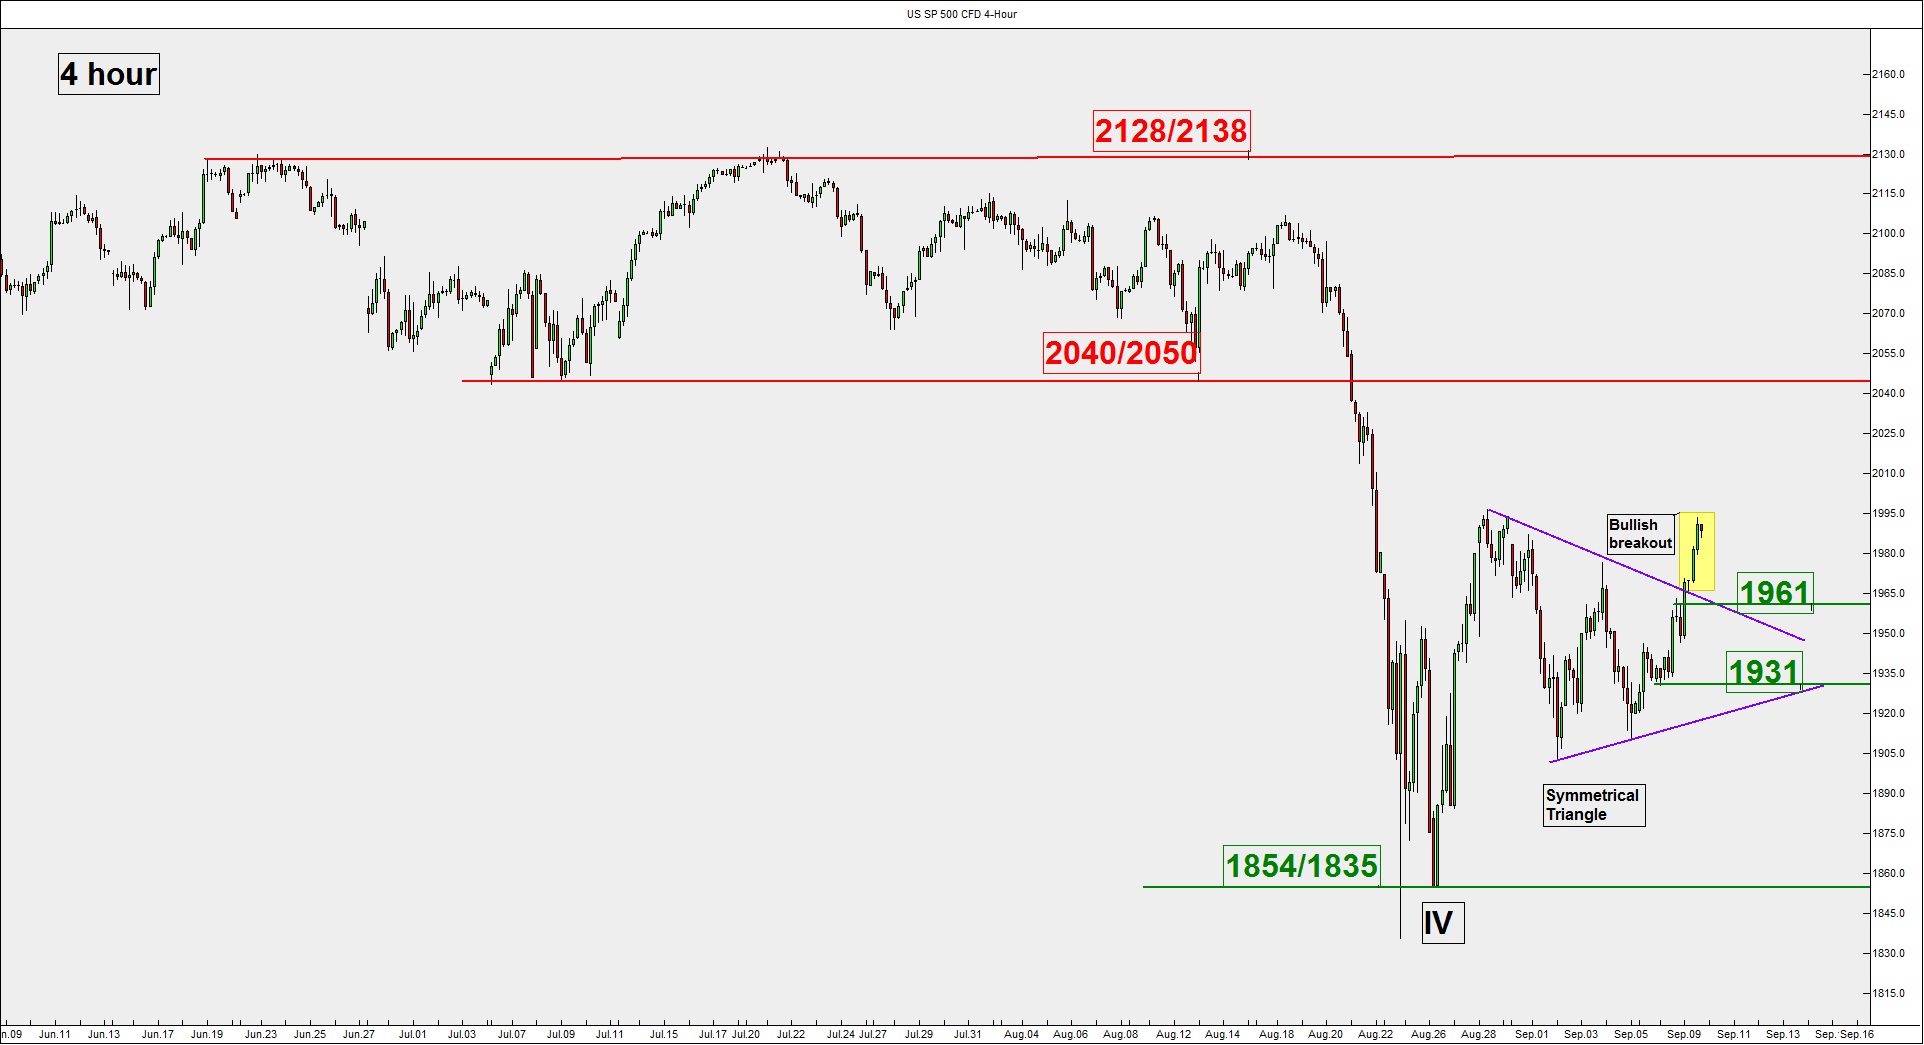
 (Click to enlarge charts)
The U.S. SP 500 Index (proxy for the S&P 500) has managed to break the upside trigger level at 1968 as expected. It has continued to surge in today’s (09 September 2015) European session and almost met our 1996 upside target (printed a current high of 1993.
Please click on this link for a recap on our previous daily outlook.
Pivot (key support): 1961
Resistance: 2040/2050
Next support: 1931
Technical elements remain bullish but do expect a potential pull-back above the 1961 daily pivotal support before another upleg occurs to target the 2040/2050 resistance.
On the flipside, a break below the 1961 pivotal support may negate the bullish tone to see a slide to test the lower boundary of the ascending channe1 at 1931.
Disclaimer
This report is intended for general circulation only. It should not be construed as a recommendation, or an offer (or solicitation of an offer) to buy or sell any financial products. The information provided does not take into account your specific investment objectives, financial situation or particular needs. Before you act on any recommendation that may be contained in this email, independent advice ought to be sought from a financial adviser regarding the suitability of the investment product, taking into account your specific investment objectives, financial situation or particular needs. All queries regarding the contents of this material are to be directed to City Index, a trading name of GAIN Capital Singapore Pte Ltd.
Trading CFDs and FX on margin carries a high level of risk that may not be suitable for some investors. Consider your investment objectives, level of experience, financial resources, risk appetite and other relevant circumstances carefully. The possibility exists that you could lose some or all of your investments, including your initial deposits. If in doubt, please seek independent expert advice. Visit cityindex.com.sg for the complete Risk Disclosure Statement.





